
Global property market 2026 Q1: data-led snapshot by region
The global property market 2026 Q1 is not a single trend. It is a set of regional stories, each driven by rates, supply, and trust. This pillar report gives you the quick global view first. Then it points you to the full deep dives we published for Europe, the USA, Southeast Asia, East Asia, Oceania, Africa, Latin America, and the Middle East.
You will see the best official indexes we used, the latest confirmed data points, and what they suggest. Use it to choose where to read next without getting lost online.
Global property market 2026 Q1 method: how we qualified data and comparisons
Global property market 2026 Q1 method follows one clear rule. We trust primary sources first. That means official statistics offices, central banks, and land departments. Next, we use respected market indexes when official series are limited. We also track timing, because many “Q1” numbers are published later. So we label what is confirmed and what is pending. Forums and social posts are used only to spot common worries, not to prove prices. Finally, we avoid mixing methods across countries. We compare direction and signals, then send you to each regional report for the full context.
Global property market 2026 Q1 data timing: why “latest” can lag
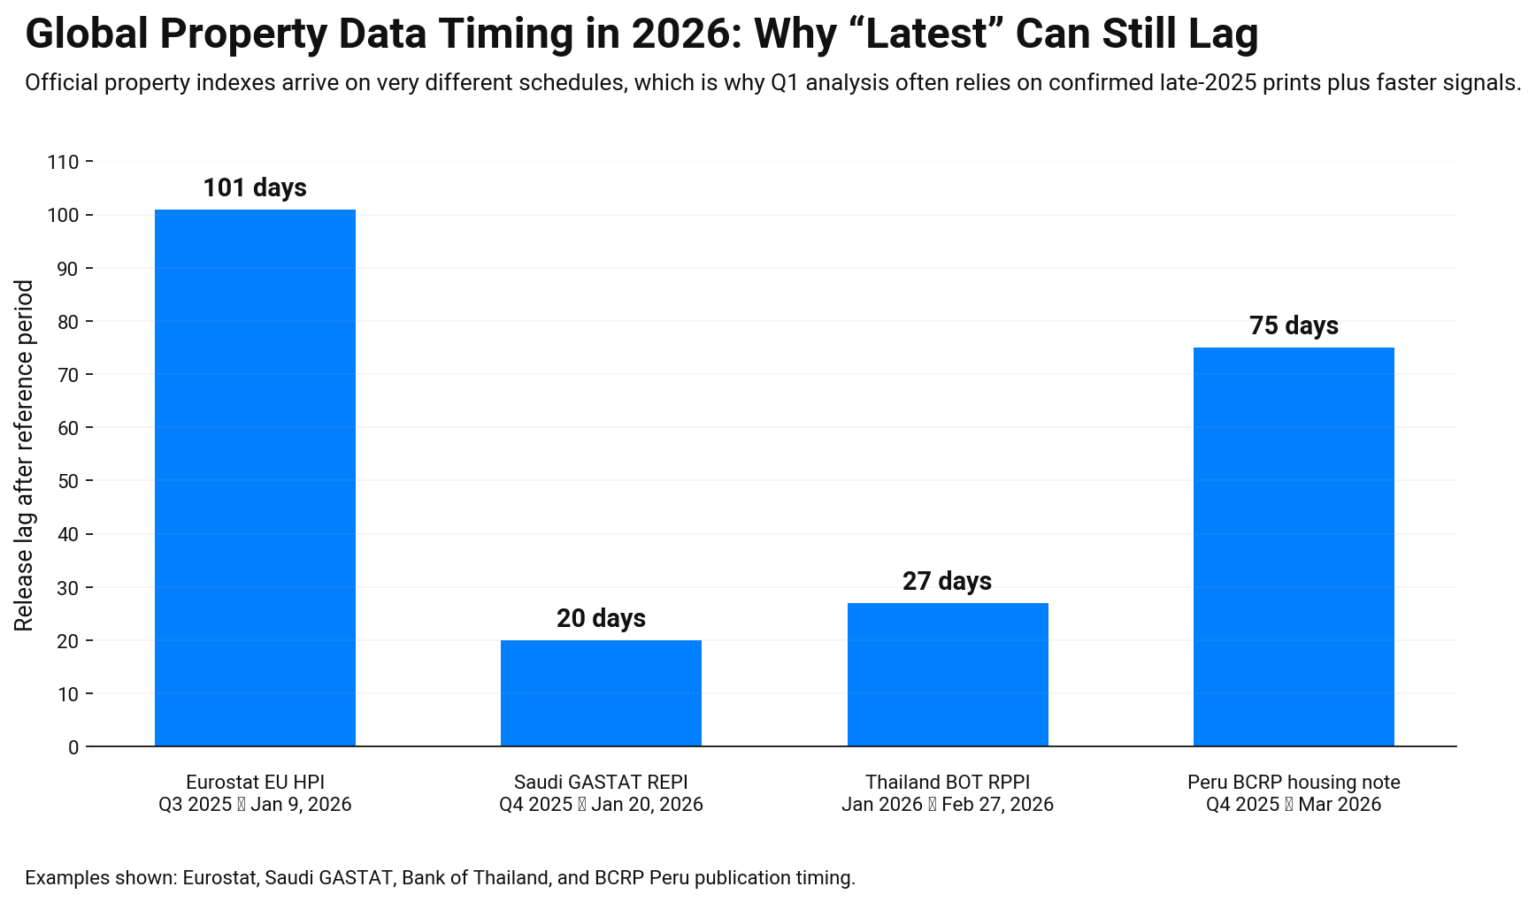
Global property market 2026 Q1 data timing can trip people up. Many official indexes publish late. So “Q1” can mean the quarter of activity, not the week you read the report. That is normal. It still matters.
Europe is a clear example. Eurostat’s newest house price update available now covers Q3 2025. It also lists the next release date for Q4 2025 as April 7, 2026. So you cannot expect a full Q1 2026 EU-wide price print yet.
Because of this lag, we do two things. We label what is confirmed. We also add fast signals, like rates and sales pace, to avoid blind spots.
In the next section, you will see a simple global dashboard table. It lines up each region with its best index and one recent data point, so you can jump to the right deep-dive without guessing.
Global property market 2026 Q1 dashboard: the fastest way to pick your region
The Global property market in 2026 Q1 dashboard helps you avoid reading ten reports just to find one key number. Each region below links to a deeper page. The table shows the best “anchor” dataset, and one confirmed point we used.
| Region report | Best anchor dataset | Latest confirmed point used | What it signals |
|---|---|---|---|
| Europe | Eurostat House Price Index | EU prices +5.5% YoY (Q3 2025) | Rising, but data lags |
| USA | Freddie Mac 30-year fixed | 6.38% (Mar 26, 2026) | Rates pressure demand |
| Southeast Asia | Country central bank indexes | Thailand BoT Jan 2026 index level | Mixed, city-driven |
| East Asia | National statistical indexes | Japan land +2.8% (Jan 1, 2026) | Up in Japan, mixed |
| Oceania | ABS/REINZ + monthly trackers | NZ median $795k (Feb 2026) | Slow recovery vibe |
| Africa | Index + policy proxies | Morocco REPI calendar (Q1 due May) | Data uneven by country |
| Latin America | Official index where available | Mexico SHF +8.9% YoY (Q4 2025) | Strong baseline in MX |
| Middle East | Land dept / central bank indexes | Qatar index 224.19→227.82 (Jan–Feb 2026) | Upward short pulse |
Use this table like a menu. Start with your region. Then read the matching report for detail and local context. Next, we’ll pull out the global patterns that show up across most markets in 2026 Q1.
What keeps repeating across regions in property market in 2026
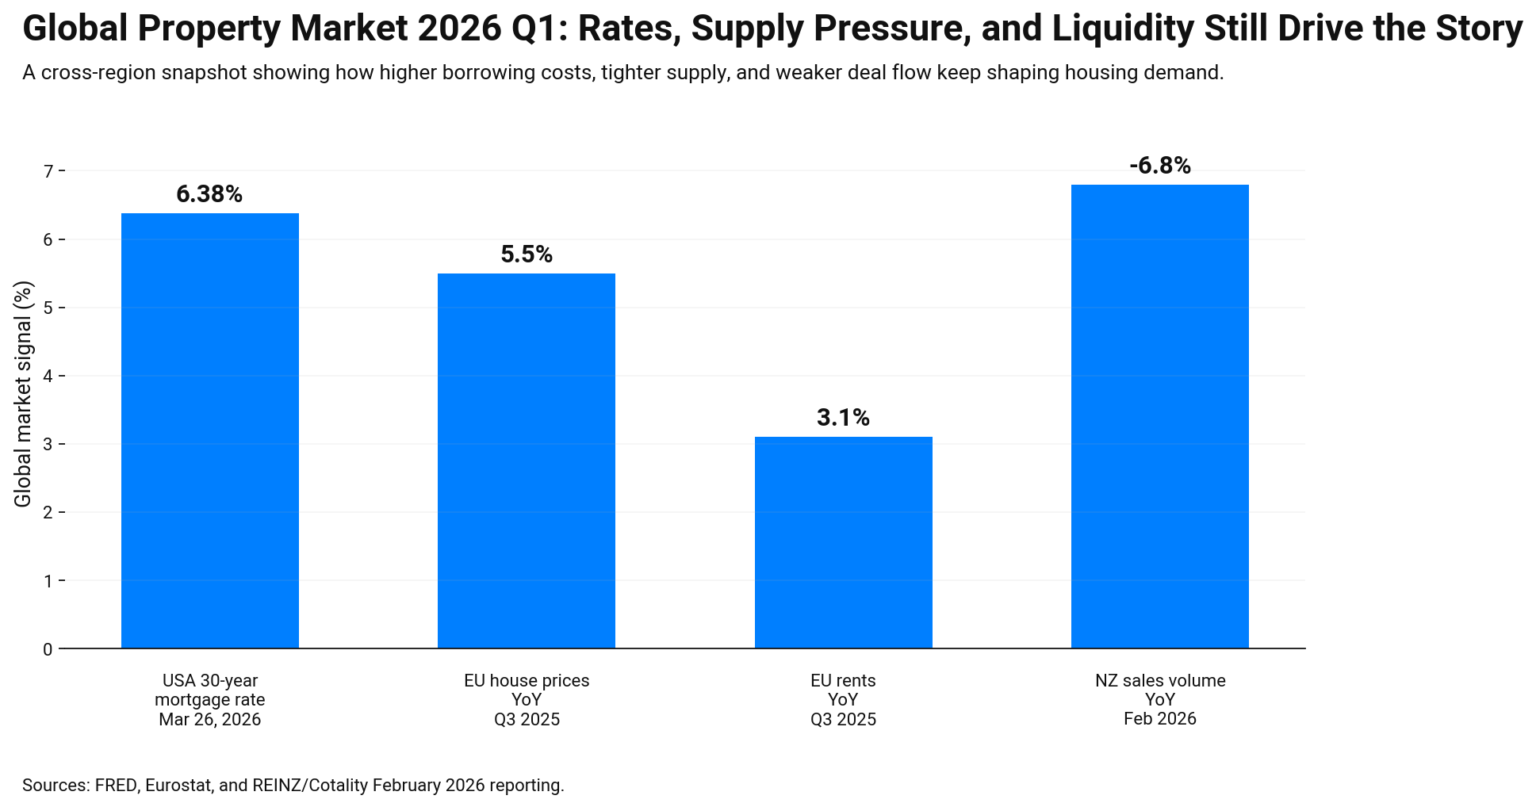
Global property market 2026 Q1 patterns look different by country, yet a few themes show up again and again. First is rates. When payments rise, demand slows fast. That is clear in the USA, where the 30-year fixed rate reached 6.38% in late March.
Next is supply. New homes do not appear overnight. So a tight supply can keep rents firm, even when buyers hesitate. Europe’s latest confirmed data still shows prices rising faster than rents at the EU level.
Then there is liquidity. Markets feel strong when deals close. They feel weak when sitting. That is why we watch sales pace and transaction values, not only asking prices.
Here are the four checks that work almost everywhere:
- Rate direction and loan rules
- Deal speed and discount levels
- New supply and permit pipeline
- Trust checks, like fees and title clarity
Finally, online discussions add one extra clue. People talk more about risk than they did before. They ask for proof. They ask for clean terms. That trust gap shapes demand in every region.
Next, we’ll build a short “developer lens” section, focused on land and redevelopment across markets.
Property market developer lens: land and redevelopment rules
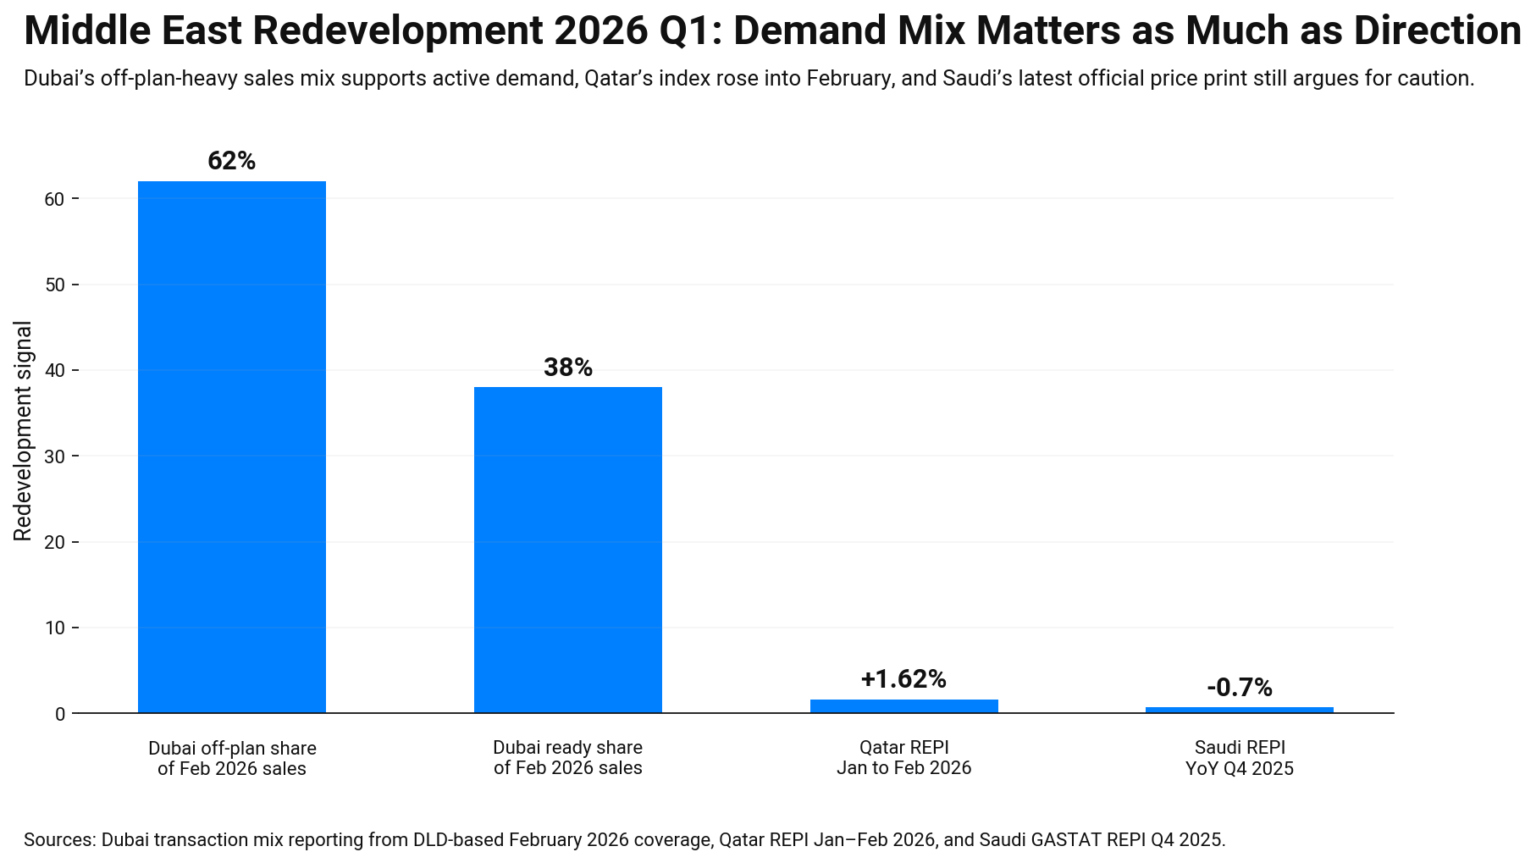
For property developers, Q1 often comes down to one thing: land math. If the land price is too high, the whole deal falls apart later. Build costs add more stress, so budgets need room. In Dubai, you can check open datasets to judge demand and transaction mix before you bid.
Next, look at what can block delivery. Permits, zoning limits, and service capacity decide whether you can build on time. Then test exit speed using closed deals, not asking prices. In Saudi Arabia, the official real estate price index fell 0.7% year on year in Q4 2025, so it is smart to exercise more caution in land bids until the next release confirms direction.
What to track next in global property market in Q2 of 2026
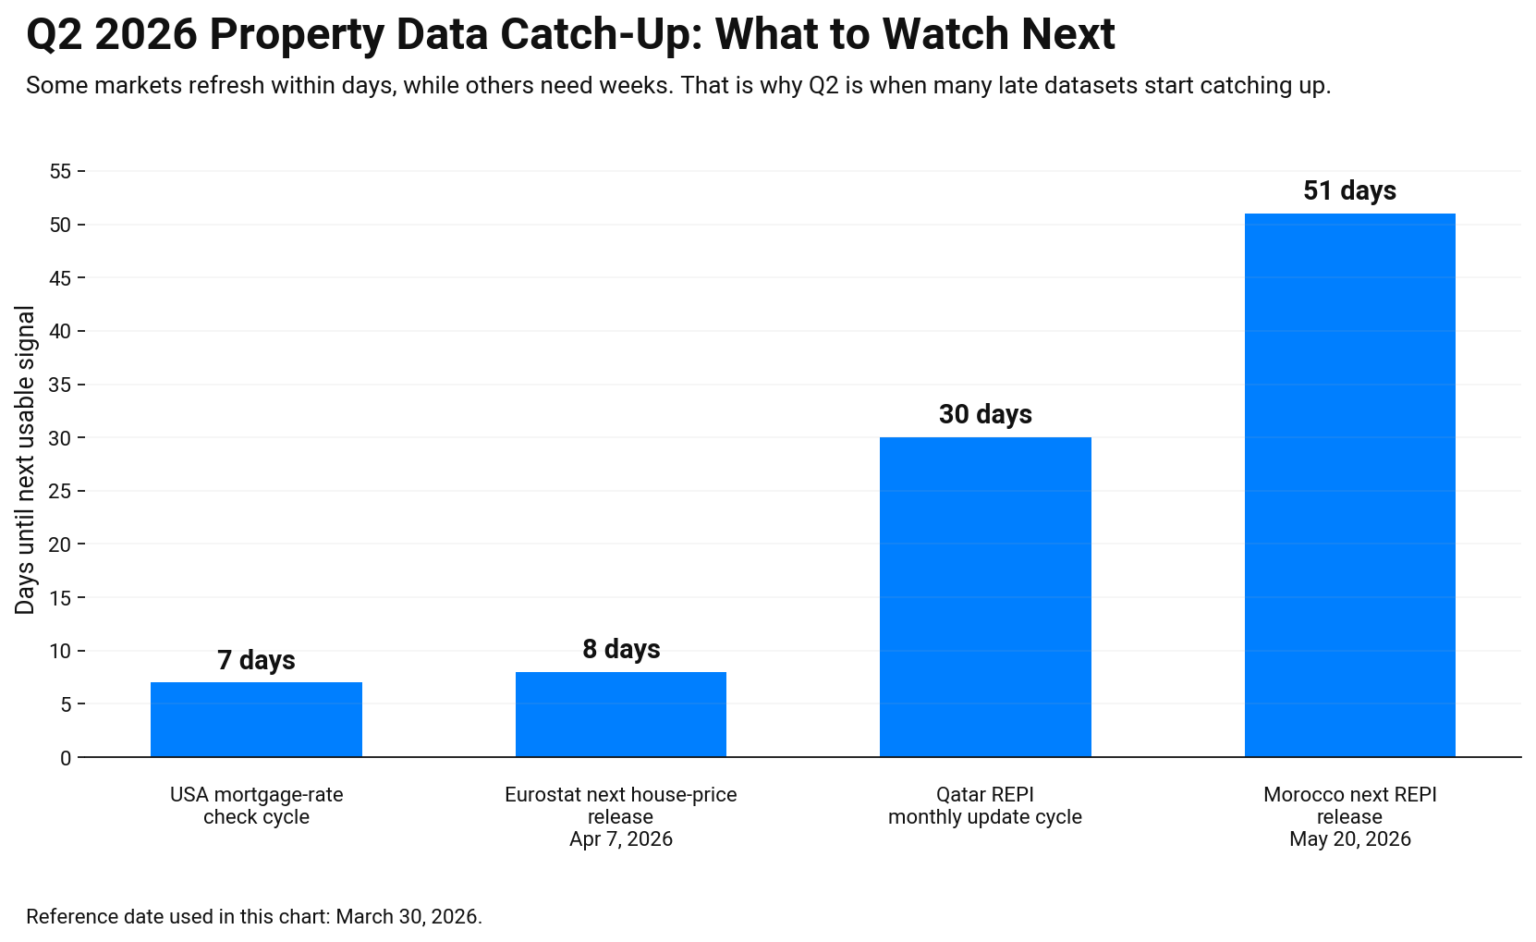
Q2 is when many “late” datasets start to catch up. So the goal is simple. Track the next official releases, then compare them with what you already see in deals.
In Europe, the next Eurostat house price release for Q4 2025 is scheduled for April 7, 2026.
In the USA, keep watching weekly mortgage rates, since they can shift demand before the monthly sales reports react.
For regional pages, watch the next local print too. In Qatar, the central bank index updates monthly, so it is a fast pulse.
In Morocco, the central bank calendar shows that Q1 2026 real estate price data is scheduled for May 20, 2026. Hence, while we wait for the next data, you can still explore Q1 reports – so in the following section, we will provide you directions on where to look for them in our environment.
Global property market 2026 Q1 regional reports: where to go deeper next
Use the sections below like a map. Each link takes you to one focused report with local data, clear timing, and a simple watchlist.
Europe property market 2026 Q1 report
Europe has strong official price and rent tracking, but the releases lag. Use this page to follow Eurostat updates and what they imply for Q2.
USA real estate market 2026 Q1 report
The USA story is rate-led. This report ties weekly mortgage moves to sales, inventory, and price indexes.
Southeast Asia property market 2026 Q1 report
Mixed markets. Fast monthly indexes in some places. Slower official prints in others. This page covers India, plus Thailand, Singapore, the Philippines, Indonesia, and Malaysia.
East Asia property market 2026 Q1 report
Japan, Taiwan, China, and South Korea move in different directions. This report shows the best index for each, with clear context.
Oceania property market 2026 Q1 report
Australia and New Zealand react to rates, sales pace, and supply in different ways. This page adds a redevelopment lens.
Africa property market 2026 Q1 report
Data quality varies more here, so the report focuses on the most usable public signals for South Africa, Kenya, Morocco, Nigeria, and Ghana.
Latin America property market 2026 Q1 report
Brazil, Chile, Peru, Paraguay, Argentina, and Mexico each need a different dataset. This report shows the cleanest baseline for each.
Middle East property market 2026 Q1 report
UAE, Israel, Qatar, Saudi Arabia, and Turkey have very different index speeds. This report compares them side by side.
For the global dashboard and links to every region, see:
How to use this global property market 2026 Q1 report
Start by choosing your goal. If you are buying a home, begin with the USA real estate market 2026 Q1 report and the Europe property market 2026 Q1 report, because rates and official price releases shape what you can afford first.
If you are renting, open the Europe report, then the Southeast Asia property market 2026 Q1 report, since supply pressure and renewal terms show up clearly there. If you are investing, scan East Asia and Middle East, because index speed and city splits often decide risk fast.
If you are a developer, go straight to the Middle East property market 2026 Q1 report and the Oceania property market 2026 Q1 report, since land math, permits, and build costs decide feasibility. Then use the Africa and Latin America reports as risk pages, because data can be uneven and due diligence matters more. Next, we’ll add a simple “global indicators dashboard” table so you can track the same signals every month.
Global property market indicators dashboard: what to track each month
Use this dashboard to track the same signals across regions. It keeps your reading consistent, even when countries publish on different schedules.
| Indicator | Why it matters | How often | Best source |
|---|---|---|---|
| Mortgage rates | Moves payments and buyer demand | Weekly | USA 30-year fixed rate (FRED) |
| EU house prices | Confirms Europe trend with a lag | Quarterly | Eurostat House Price Index release |
| Dubai price + deal mix | Shows direction and mix effects | Monthly | Dubai Land Department open data |
| Qatar price index | Fast national price pulse | Monthly | Qatar Central Bank index |
Next, we’ll add a short glossary so readers understand terms like YoY, QoQ, and real prices without guessing.
Property market glossary: simple terms used in our reports
This glossary keeps the report easy to follow. The same word can mean different things across countries, so we define it once here.
YoY (year on year): compares this period to the same period last year.
QoQ (quarter on quarter): compares this quarter to the last quarter.
MoM (month on month): compares this month to the last month.
HPI (house price index): a tracked series that shows price direction over time.
Nominal prices: prices as shown today, without inflation adjustment.
Real prices: prices adjusted for inflation, to show true buying power change.
Transaction volume: number or value of deals completed in a period.
Inventory: how many homes are listed or available for sale.
Months of supply: how long inventory would last at the current sales pace.
Off-plan: sold before completion, often used in new-build markets.
Prime: best locations or highest-quality stock with strongest demand.
Use these definitions as you read the tables and country sections, so “YoY” and “real prices” don’t get misread. They also help you compare regions fairly, even when each market publishes different kinds of indexes.
Global property market 2026 Q1 conclusion: use the map, then go local
This pillar page is your shortcut, not the full story. Use the dashboard to pick the right region fast, then open the deeper report for local data and context. Keep timing in mind, because many official prints lag. Track rates, supply, and deal speed in your target city. That is how you act with fewer surprises.
Global property market 2026 Q1 frequently asked questions
These FAQs answer the main questions readers ask after the global property market 2026 Q1.
Why do some “Q1 2026” price numbers look old?
Many official indexes are published with a delay. Use Q1 as the activity period, then confirm with the next release date listed by the official source.
Which report should I open first if mortgage rates matter most?
Start with the USA report, since weekly mortgage rates move demand fast, then compare with Europe for the lagging official price confirmation.
Start with the USA report, since weekly mortgage rates move demand fast, then compare with Europe for the lagging official price confirmation.
Dubai and Qatar update frequently through strong public datasets. They are useful for spotting short turns before quarterly reports catch up.
Where is data quality most uneven, so I should double-check more?
Africa and parts of Latin America. Those pages focus on the best public signals and the due diligence checks that matter most.
What are the three signals that predict a market turn earliest?
Mortgage rate direction, transaction pace, and new supply timing. When those three shift together, prices usually follow later.