
South Asia property market 2026 Q1: what the region shares
The Southeast Asia property market 2026 Q1 is not a monolithic story. Rates, rules, and supply change from city to city. In this report, we cover India, Thailand, Singapore, the Philippines, Indonesia, and Malaysia.
You will see which official price indexes are available now, and which ones arrive later. Then we explain what those numbers hint at about demand, rents, and resale speed.
We also add a short “forum pulse” to show what people worry about, so you know what to double-check. Use it to plan smarter moves this quarter. Next, we start with India, because its index gives a broad multi-city view.
For the global dashboard and links to every region, see:
India property market 2026 Q1 housing prices: what the latest RESIDEX shows
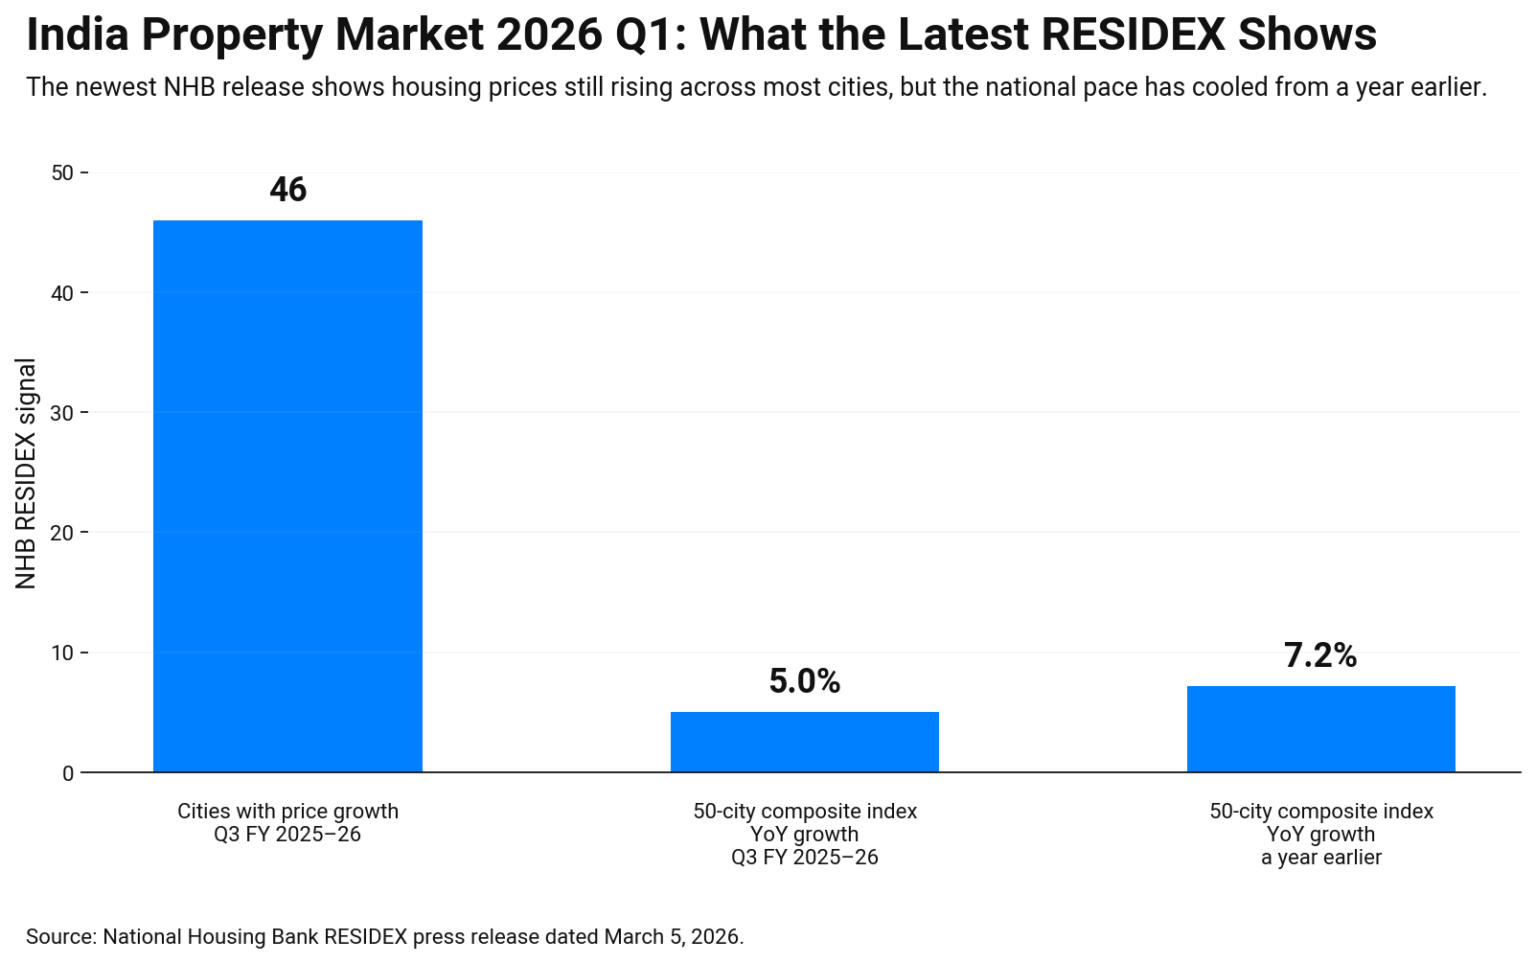
South Asia property market is strongly shaped by the Indian market in 2026 Q1. Housing prices are best tracked with NHB RESIDEX, because it covers many cities with one method. The newest press release, dated March 5, 2026, reports that prices rose in 46 cities in Q3 FY 2025–26. It also says the 50-city composite index was up 5.0% year on year, which is slower than the 7.2% rise a year earlier. That change matters because it hints that growth is still positive, yet less heated.
Still, city results vary a lot. Some big markets saw stronger gains than others, so local checks matter more than national averages. For a quick read, use RESIDEX as the “direction” tool, then compare it with listings, new supply, and loan terms in your target area
Next, we move from India to Thailand, where monthly price data gives a pulse.
Thailand property market 2026 Q1: price signals and supply pressure
The Thailand property market 2026 Q1 looks calm in the index, yet tense in real life right now. Prices move in small steps, while buyers argue over value, stock, and rent. This section uses Bank of Thailand price indexes and a Bangkok real-price series to show the pulse and the lag.
Thailand property market 2026 Q1 Bank of Thailand index: monthly momentum
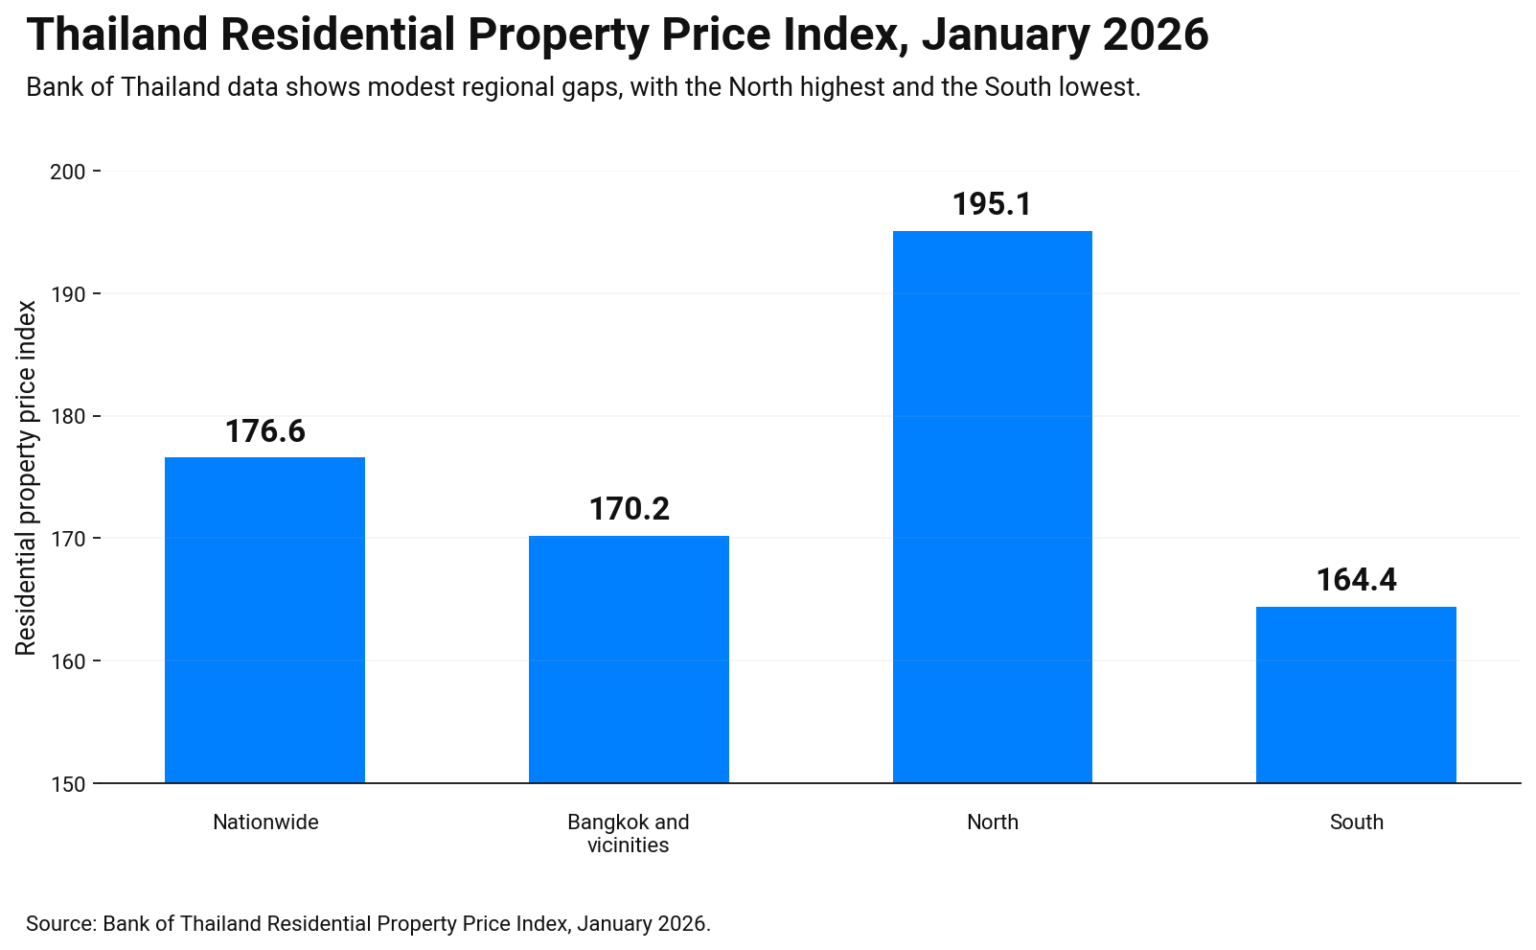
The Bank of Thailand publishes a residential property price index that updates each month. In January 2026, the nationwide index reads 176.6. Bangkok and its vicinities sit at 170.2. North is higher, at 195.1, while the South is lower, at 164.4. These gaps remind you to stay local. Even within one district. The changes from late 2025 are small, so the story is gradual drift, not a sudden jump. Use this series to spot turns early, because it arrives faster than many quarterly reports.
Thailand property market 2026 Q1 Bangkok real prices and supply talk
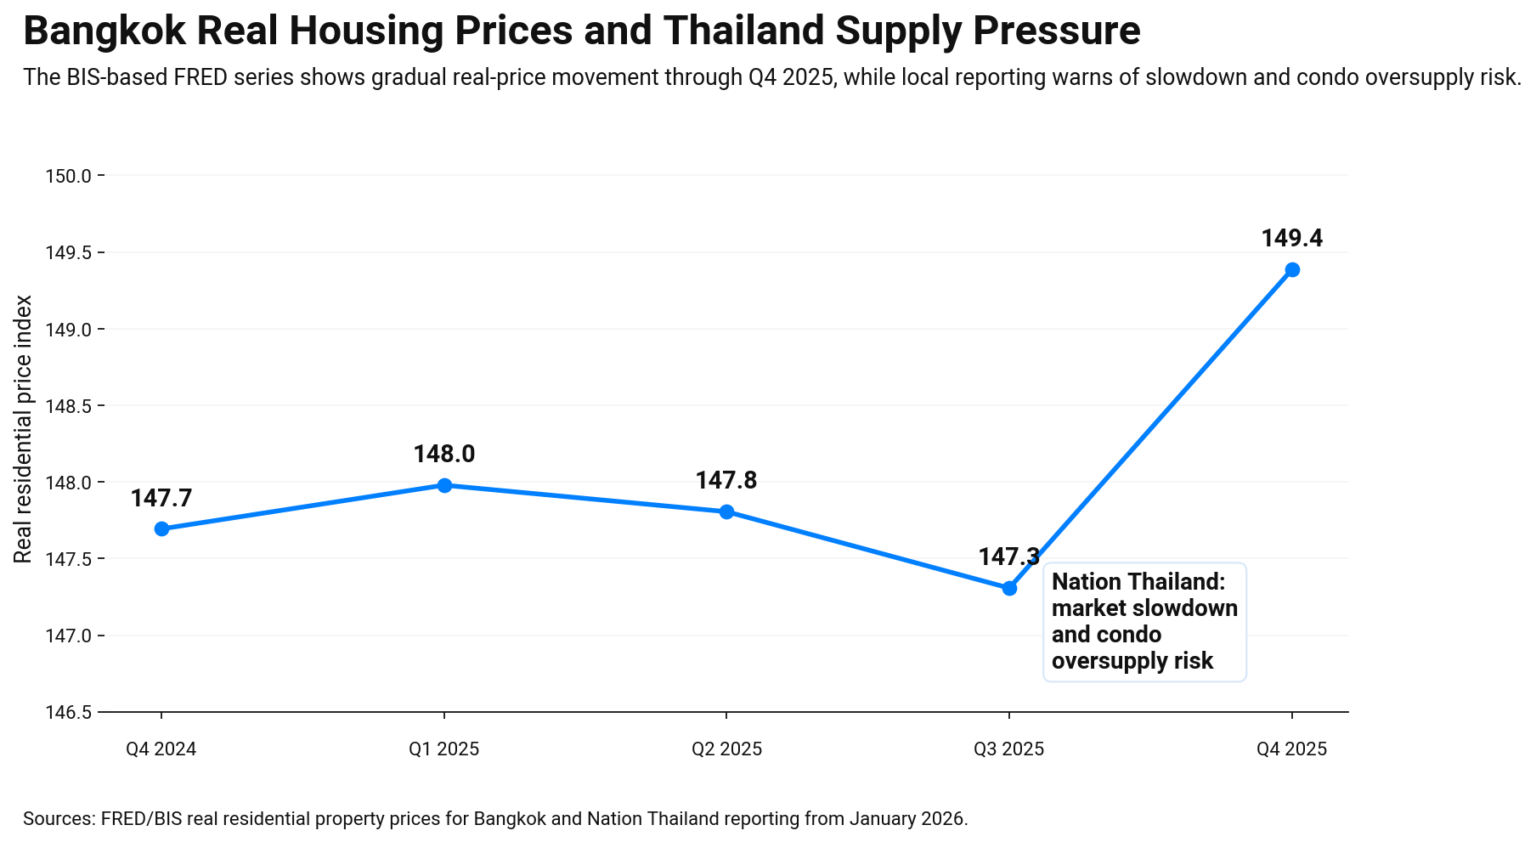
Next, we move to Singapore, where official prices come in quarterly releases, and policy can shift demand quickly overnight.
Singapore property market 2026 Q1: prices, policy, and buyer talk
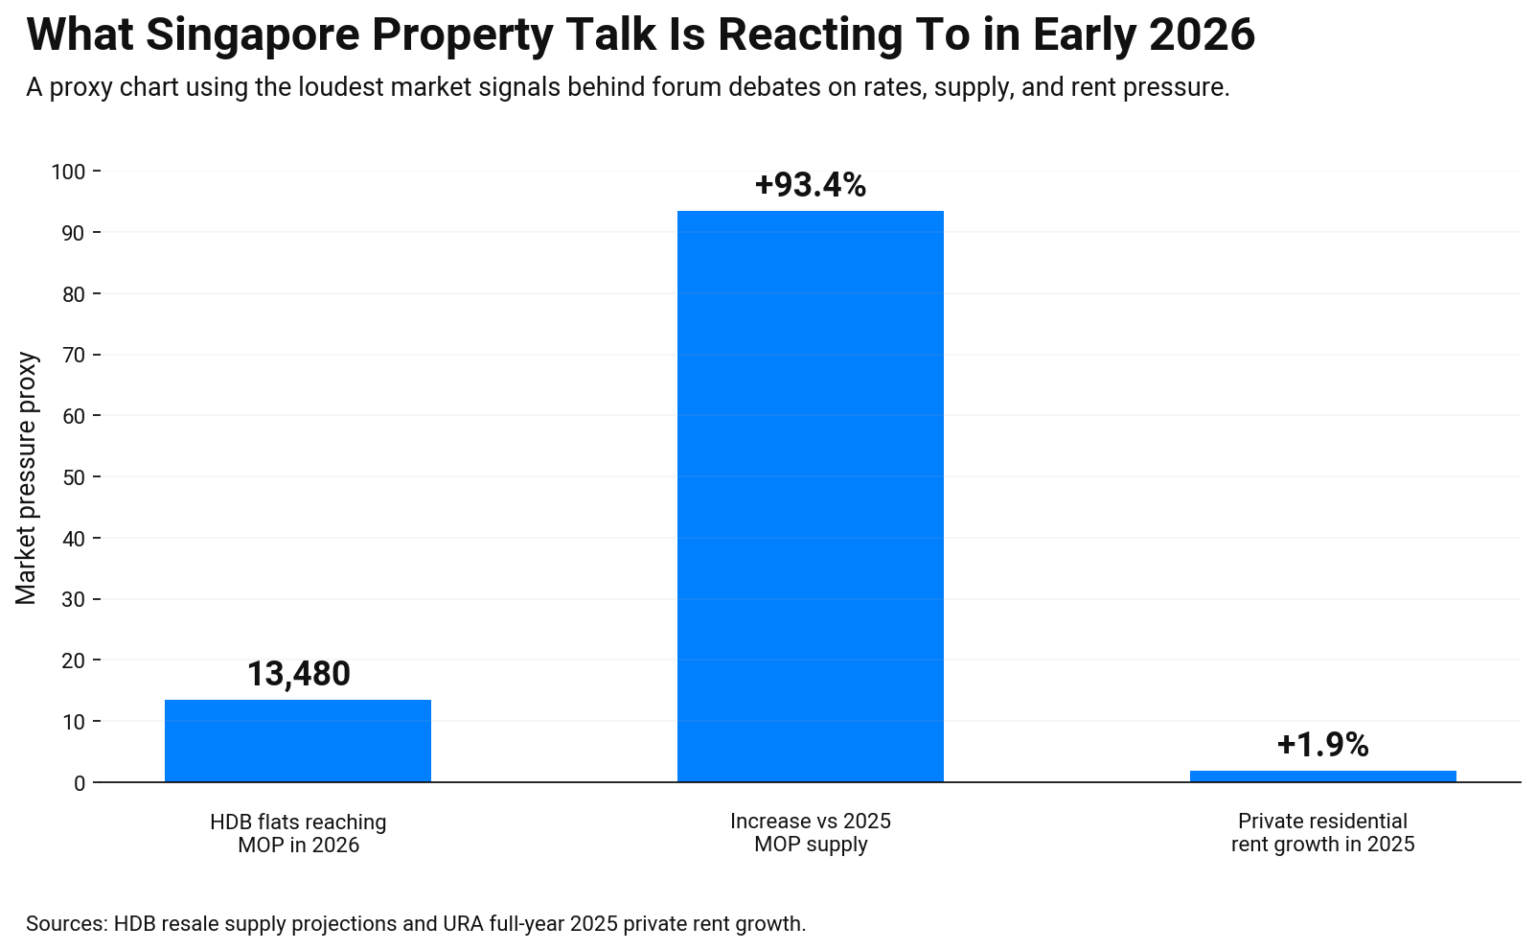
The Singapore property market 2026 Q1 can look steady in charts, yet busy in daily chatter. Official price data comes in set drops, not live streams. So timing is part of the story. Here we use URA releases for the hard numbers, then add what people debate this quarter.
Singapore property market 2026 Q1 URA price index and release timing
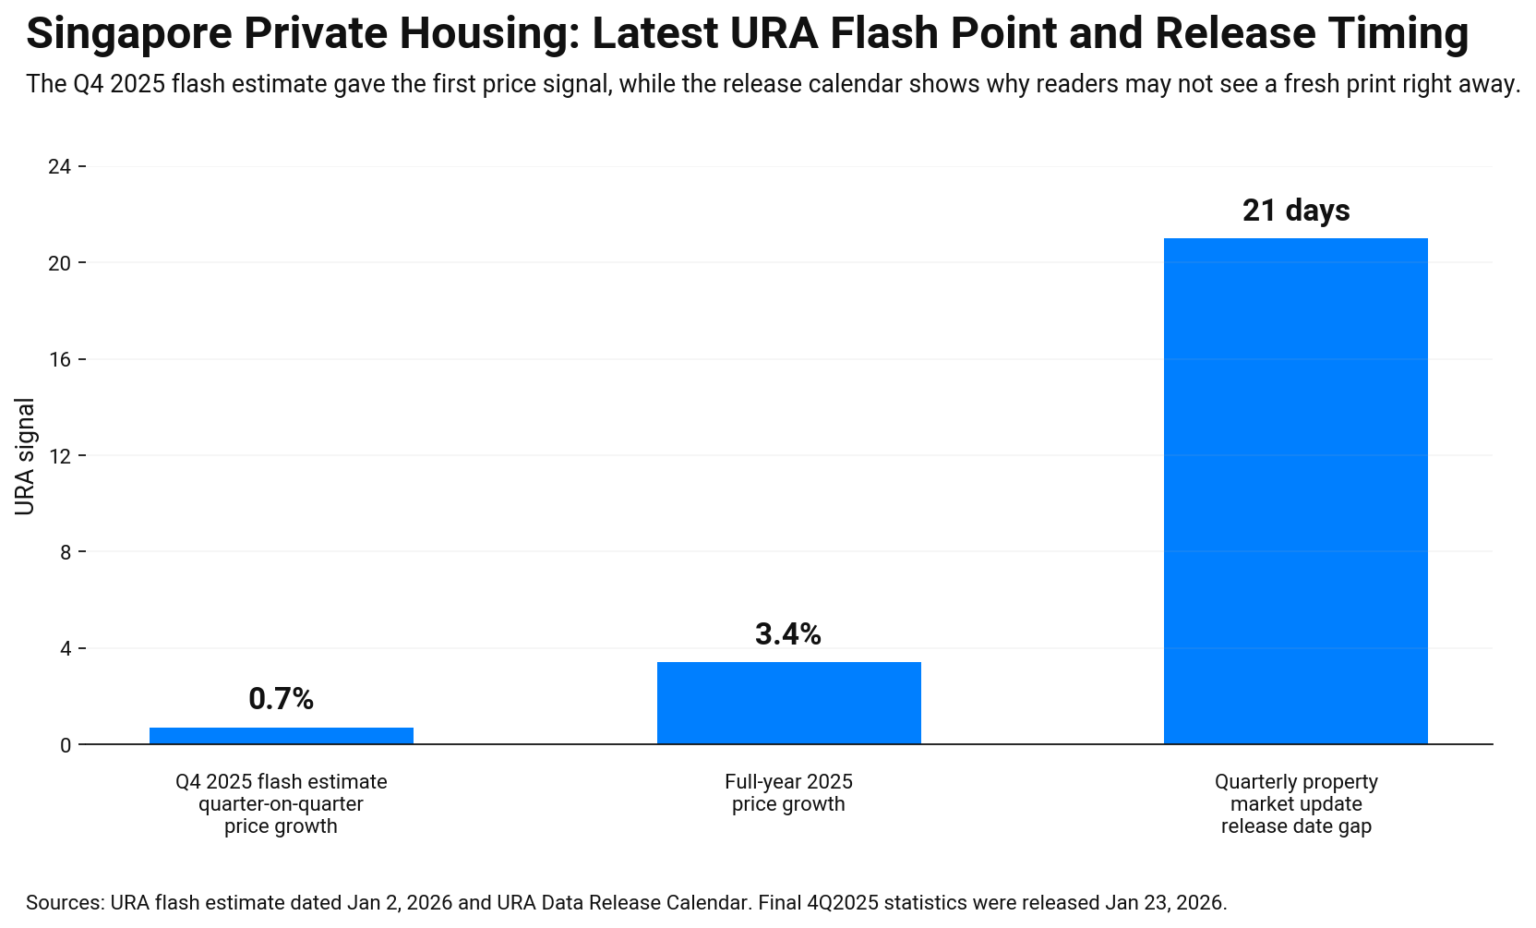
That matters for Q1 because many readers expect a fresh print, yet it may not be out the moment they search. The URA data release calendar helps you track when key updates land, including rentals, launches, and pipeline figures.
Singapore property market 2026 Q1 discussions: rates, supply waves, and resale fear
Next, we move to the Philippines property market 2026 Q1, where the central bank report already shows how price growth cooled.
Philippines property market 2026 Q1: price growth slows and buyers get picky
The Philippines property market 2026 Q1 price trend is cooling in early 2026, and the central bank index makes that clear. The Bangko Sentral ng Pilipinas Residential Property Price Index for Q4 2025 shows national prices growing in low single digits year on year, while quarter-on-quarter movement turned negative in both NCR and areas outside NCR. That mix often means buyers negotiate harder, while developers lean on promos.
| Area | Year on year | Quarter on quarter |
|---|---|---|
| National | Low single-digit rise | Slight move |
| NCR | Modest rise | Decline |
| Outside NCR | Small rise | Decline |
Use this as a guide, not a promise. If you rent, watch new completions and renewal terms. If you buy, compare resale speed by district and check the loan rules. Next, we move to Indonesia, where primary-market prices have been rising only slightly.
Indonesia property market 2026 Q1: slow price growth in the primary market
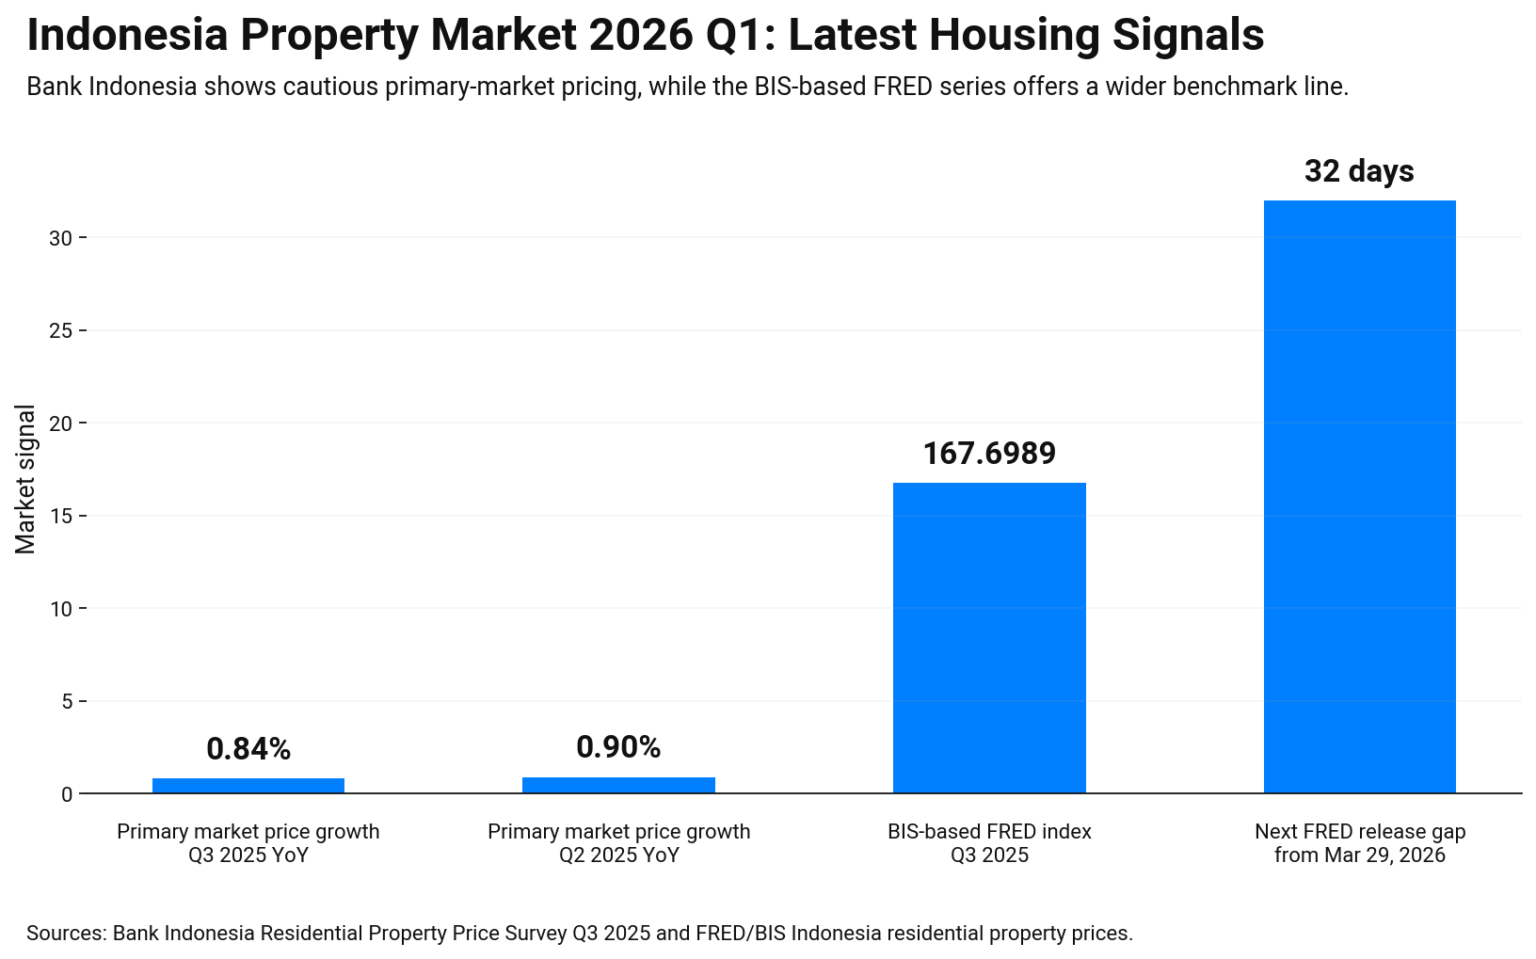
Indonesia’s property market in 2026 Q1 looks steady, not hot, in the latest reports. Bank Indonesia’s Residential Property Price Survey for Q3 2025 said prices in the primary market rose only 0.84% year on year, slightly lower than 0.90% in Q2 2025. That is a small move, yet it tells you demand is cautious, and developers have limited room to push prices.
For a benchmark, the BIS-based series on FRED shows Indonesia’s residential property price index at 167.6989 in Q3 2025, and it lists the next release date as April 30, 2026. Use this as a trend line, then compare it with your city’s supply, since Jakarta and resort areas can behave differently.
BPS also publishes a Residential Property Price Index report built from a 2025 survey that covers 58 regencies and cities across 36 provinces. That helps you keep comparisons consistent, especially when social media claims swing fast. Next, we move to Malaysia, where the housing index is tracked through NAPIC releases.
Malaysia property market 2026 Q1 house price index: what MHPI data helps you track
Malaysia property market 2026 Q1 house price index is best followed through NAPIC’s Malaysian House Price Index (MHPI). NAPIC keeps the official MHPI tables and reports in one archive, which makes source checks simple.
Many dashboards also quote a Q4 2025 MHPI level around 234.40. Treat that as a quick reference, then confirm using NAPIC tables when you cite numbers.
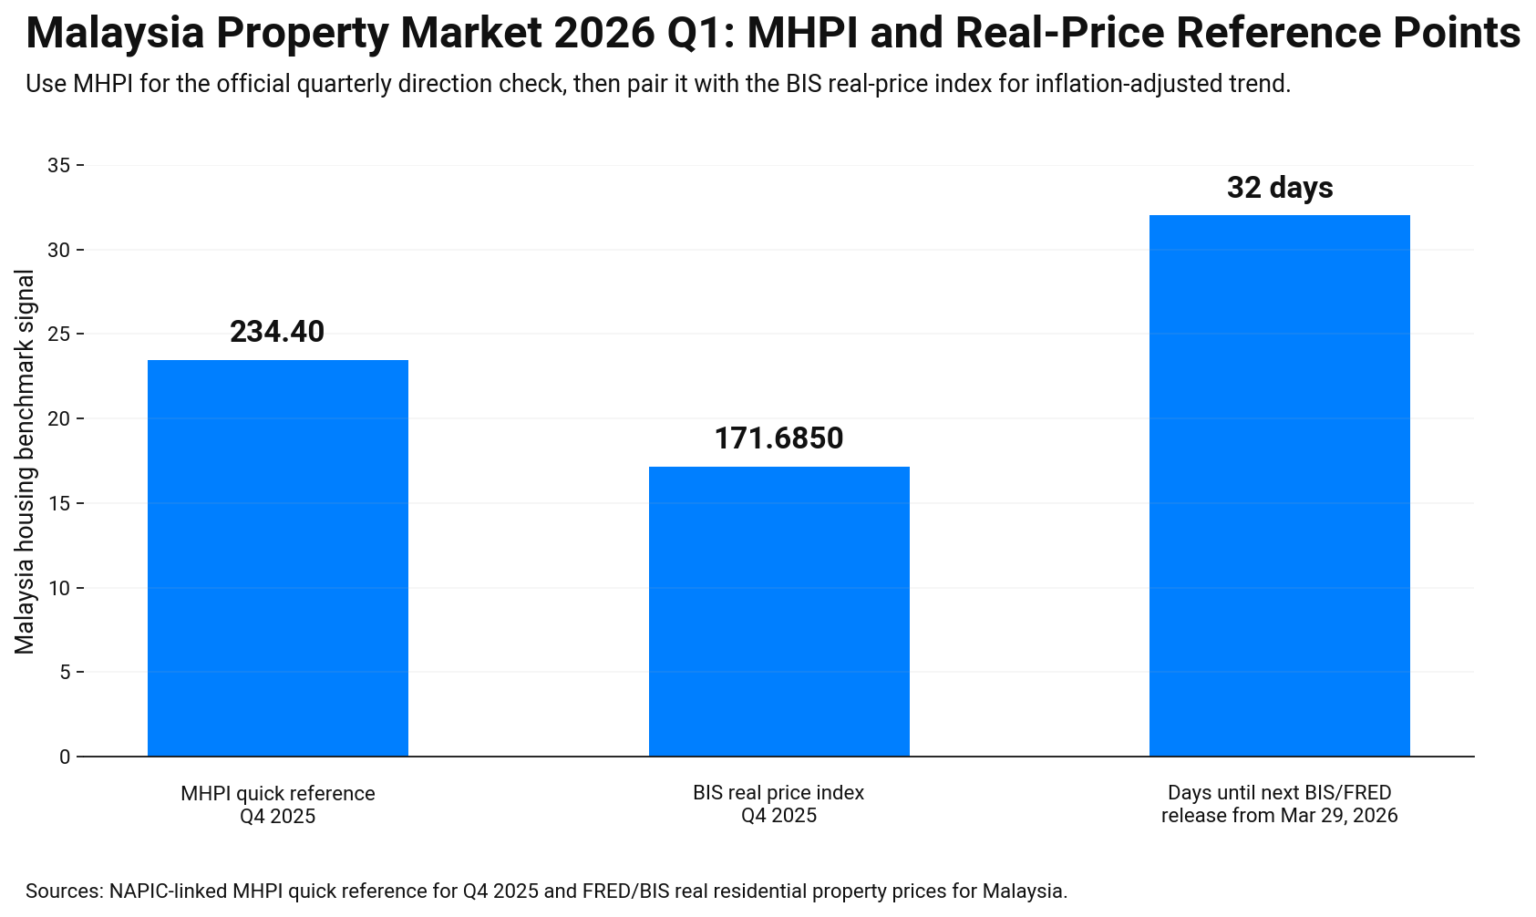
Here is how to use the data without overthinking it:
- Track MHPI direction each quarter, not one month of noise.
- Compare it with transaction pace and overhang tables in NAPIC market reports.
- Pair it with the BIS “real price” index for Malaysia to see the inflation-adjusted trend.
If you are picking a city, add local supply and job growth into the mix, because Kuala Lumpur, Penang, and Johor can behave differently. Next, we move to the regional summary so the six markets connect into one view.
Southeast Asia property market 2026 Q1 summary: one view across six countries
The Southeast Asia property market 2026 Q1 summary is easier when you compare the same facts. We use official prints, then read the directions overall.
| Country | Main dataset to cite | Latest point available now | What it signals for 2026 Q1 |
|---|---|---|---|
| India | NHB RESIDEX | Q3 FY 2025–26: composite +5.0% YoY | Still rising, but slower |
| Thailand | Bank of Thailand RPPI | Jan 2026: Nationwide 176.6; Bangkok 170.2 | Small moves, slow turns |
| Singapore | URA private price index (flash) | Q4 2025: +0.7% q-o-q; 2025: +3.4% | Q1 pending; policy matters |
| Philippines | BSP RPPI | Q4 2025: National +1.6% YoY; q-o-q down | Buyers negotiate harder |
| Indonesia | Bank Indonesia RPPS | Q3 2025: Primary market +0.84% YoY | Mild growth |
| Malaysia | NAPIC MHPI | Latest MHPI in NAPIC archive | Best for trend reading |
Use the table like a map. Monthly markets let you react faster. If releases lag, track rates, listings, and deal speed. Next, we’ll build a 2026 Q2 watchlist for these six markets.
Southeast Asia property market 2026 Q1 summary: one view across six countries
Southeast Asia property market 2026 Q1 summary gets clearer when you compare the same type of source. Each country has its own “best index,” and the release timing is part of the story. India’s RESIDEX shows growth is still positive, but slower. Thailand’s Bank of Thailand index updates monthly, so it gives a faster pulse. Singapore’s URA index is strong, yet Q1 depends on the next release.
The Philippines already shows cooling growth in the BSP report. Indonesia’s primary market prices rose only slightly in the latest BI survey. Malaysia’s MHPI is best tracked through NAPIC archives.
To keep this usable, focus on three checks:
- Use official indexes for direction, not one-off headlines.
- Watch rate moves and loan rules, because demand reacts fast.
- Track local supply and days-on-market, since cities behave differently.
With that base in place, the next section turns these signals into a simple 2026 Q2 watchlist you can follow each month.
Southeast Asia property market 2026 Q2 watchlist: what to track next
Southeast Asia property market 2026 Q2 watchlist starts with release dates, because new prints can change the story fast. First, track the next URA update in Singapore and compare it with the new launch supply.
Next, watch Thailand’s monthly index for any turn in Bangkok. Then follow India’s next RESIDEX release to see if the slower pace holds.
For the Philippines, look for the next BSP RPPI and check if quarter-on-quarter moves stay weak. In Indonesia, watch BI survey updates and loan terms. In Malaysia, use the new NAPIC tables plus transaction pace.
Conclusion
Southeast Asia property market 2026 Q1 shows one clear lesson: timing and local supply matter more than hot takes. Some countries publish fresh data often, while others confirm trends later. That is why you should use official indexes for direction, then validate with listings, loan rules, and resale speed in your target city. Keep an eye on rates and new completions, because they change demand quickly. With the Q2 watchlist, you can track shifts early and act with more confidence.
Southeast Asia property market 2026 Q1 frequently asked questions
These FAQs answer the main questions people ask after reading this Southeast Asia property market 2026 Q1 report.
Which data sources are most reliable for this report?
We prioritize official sources: NHB RESIDEX for India, BoT for Thailand, URA for Singapore, BSP for the Philippines, BI for Indonesia, and NAPIC for Malaysia.
Why do some countries look “quiet” even when people complain online?
Indexes move slowly and publish on schedules. Forums react to rent renewals, listings, and rate changes, so stress can rise before quarterly data shows it.
What is the fastest way to spot a market turn in 2026 Q1?
Watch borrowing conditions and monthly or high-frequency releases. Thailand’s residential index updates monthly, and it can show direction earlier than quarterly reports.
Is it safe to compare prices across these countries using one number?
Not fully. Each index has different coverage and methods. Use them for within-country trend direction, then compare by city basics like supply, incomes, and loan access.
What should buyers and renters verify before making a move?
Check total fees, renewal terms, and unit condition in writing. Also confirm legal steps, title status, and payment timelines, since rules and norms vary a lot by country.