
East Asia property market 2026 Q1: Japan, Taiwan, China, and South Korea data snapshot
East Asia property market 2026 Q1 looks simple from far away, but it is not. Each country has its own index, its own timing, and its own pressure points. In this report, we focus on Japan, Taiwan, China, and South Korea. You will see the newest official data we can confirm today, plus what it suggests for prices and demand.
We also explain why some numbers arrive later than the quarter you are in. Finally, we add a short view of what people discuss online, so you know what to verify before you act.
For the global dashboard and links to every region, see:
East Asia property market 2026 Q1 Japan: land prices keep rising
East Asia property market 2026 Q1: Japan is the easiest to read through official land price data. It updates once a year, so it is not “live.” Still, it is a strong benchmark. It tells you where pressure is building, and where it is fading.
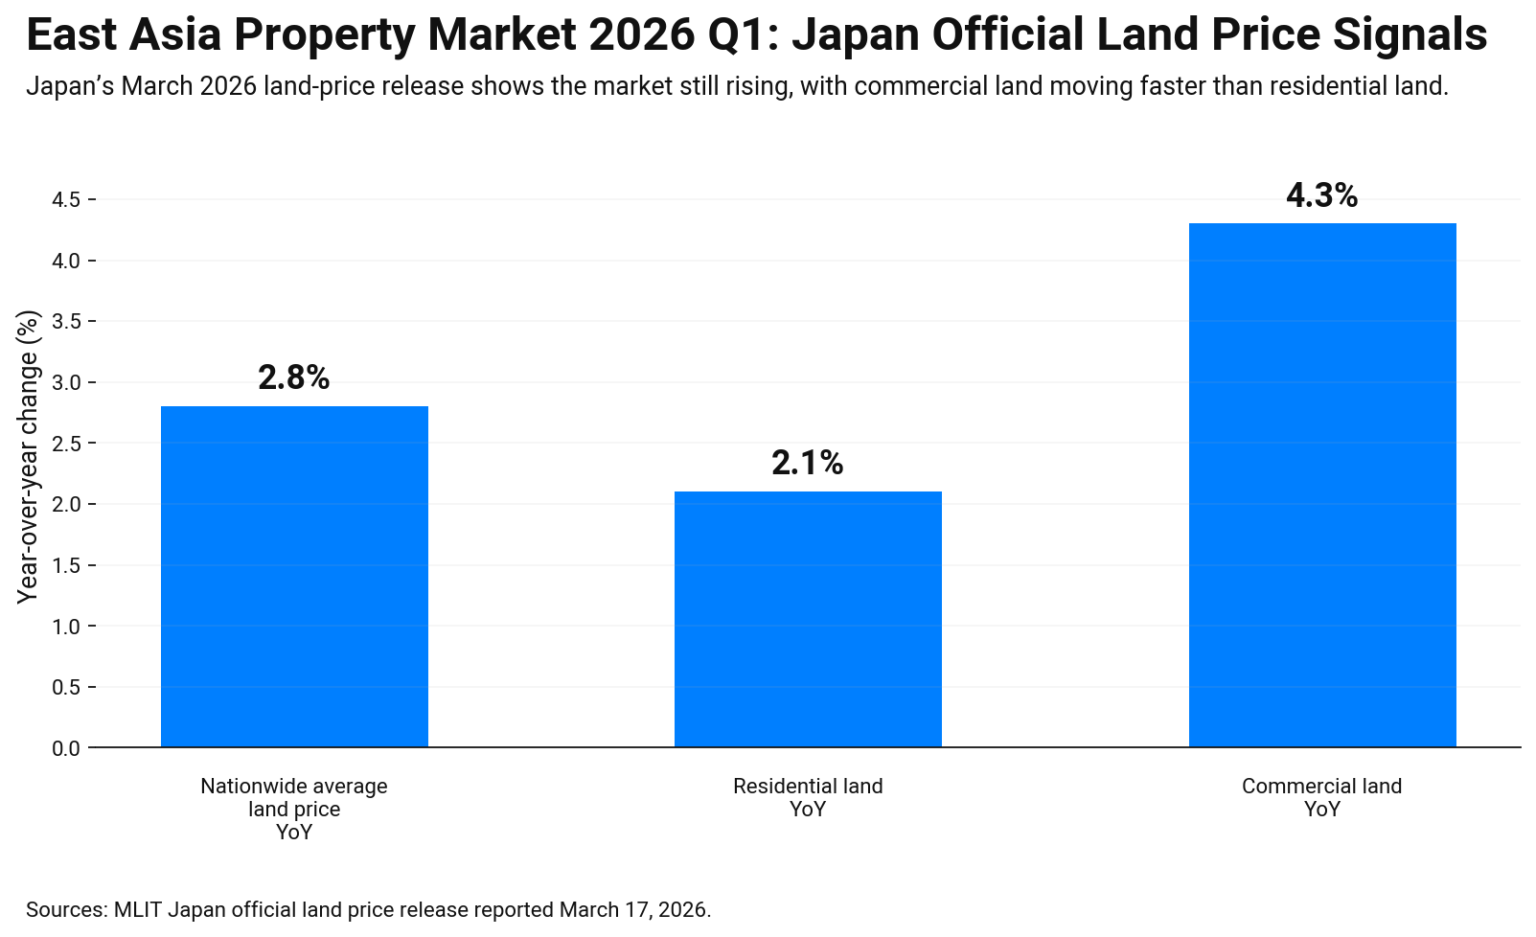
Japan’s land ministry data, reported in March 2026, says the nationwide average land price rose 2.8% year on year as of Jan 1, 2026.
Residential land also rose. It climbed 2.1% across the country. Commercial land moved faster, which often tracks business demand and prime locations. Some urban areas saw stronger gains than the national average.
So what should you take from this? Japan is not flat right now. It is rising, but not evenly. If you look only at one city, you can miss the wider shift.
Next, we move to Taiwan, where the official housing price index has already been falling for several quarters.
East Asia property market 2026 Q1 Taiwan: prices are easing in the official index
East Asia property market 2026 Q1 Taiwan is showing a softer price path in the newest official update. Taiwan’s Ministry of the Interior publishes a housing price index that tracks repeat sales. So it is built to show trend, not hype.
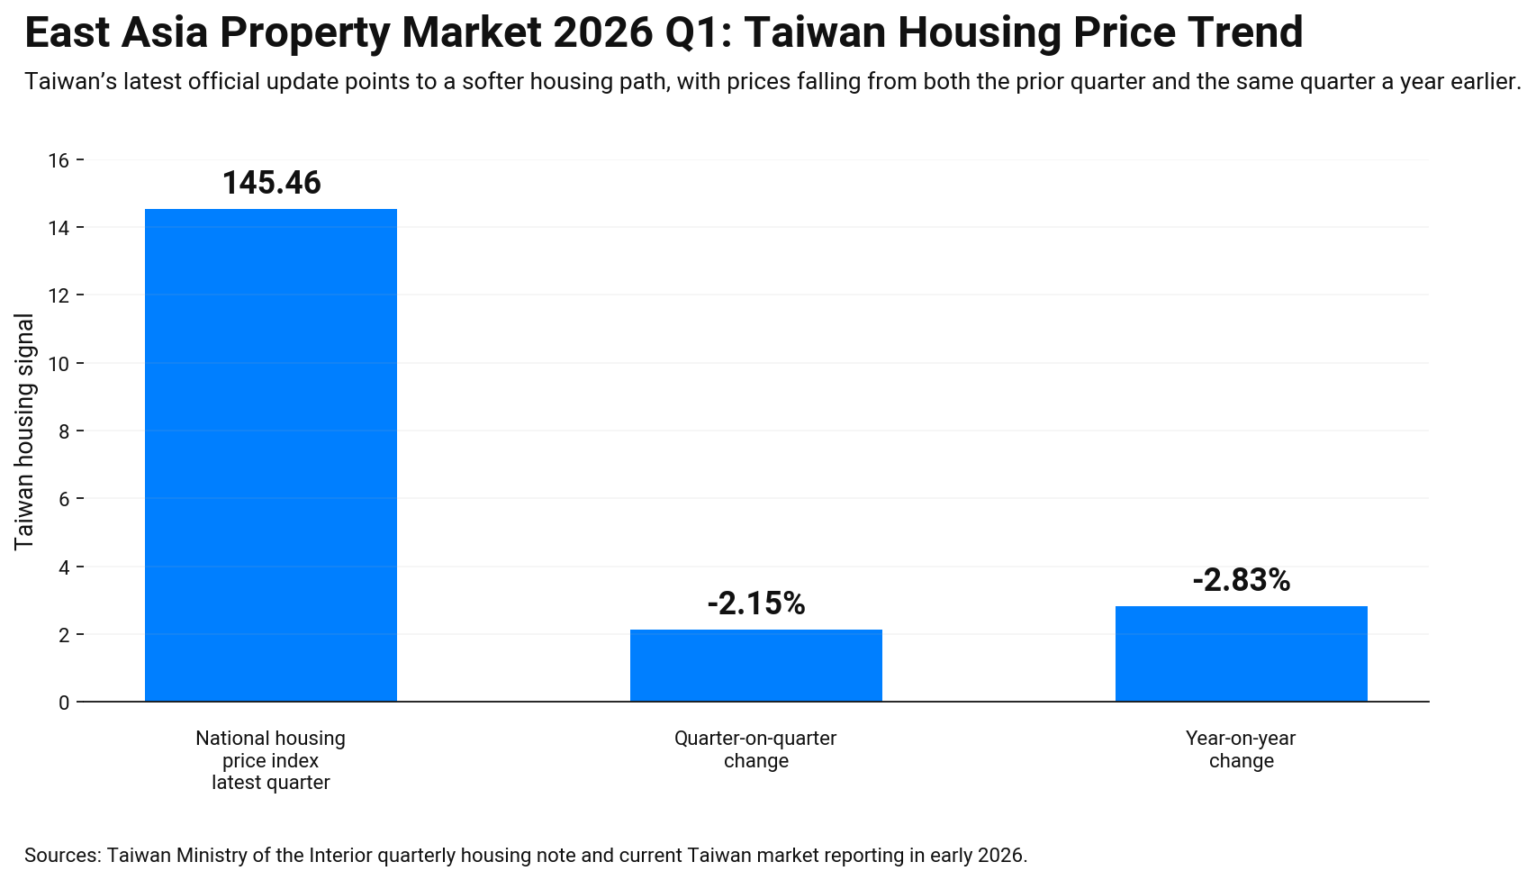
In the latest quarterly note, the national housing price index is 145.46. It fell 2.15% from the prior quarter. It also fell 2.83% from the same quarter last year. The report adds one more key point. Prices have dropped for three quarters in a row since a peak in 2024 Q4.
That does not mean every district is cheap. Some areas hold up better than others. Still, the direction is clear. Buyers are getting more cautious. They compare more units. They also ask harder questions about value.
Next, we move to China, where the national 70-city survey still shows broad weakness, even while a few top cities look steadier month to month.
East Asia property market 2026 Q1 China: prices are still under pressure
East Asia property market 2026 Q1 China is still in a slow repair phase. National numbers stay weak, yet some top cities look less bad month to month. This section uses the official 70-city survey, plus a read on what it means for buyers, sellers, and developers.
China property market 2026 Q1 70-city data: what changed in 2026
East Asia property market 2026 Q1 China prices: February shows broad weakness
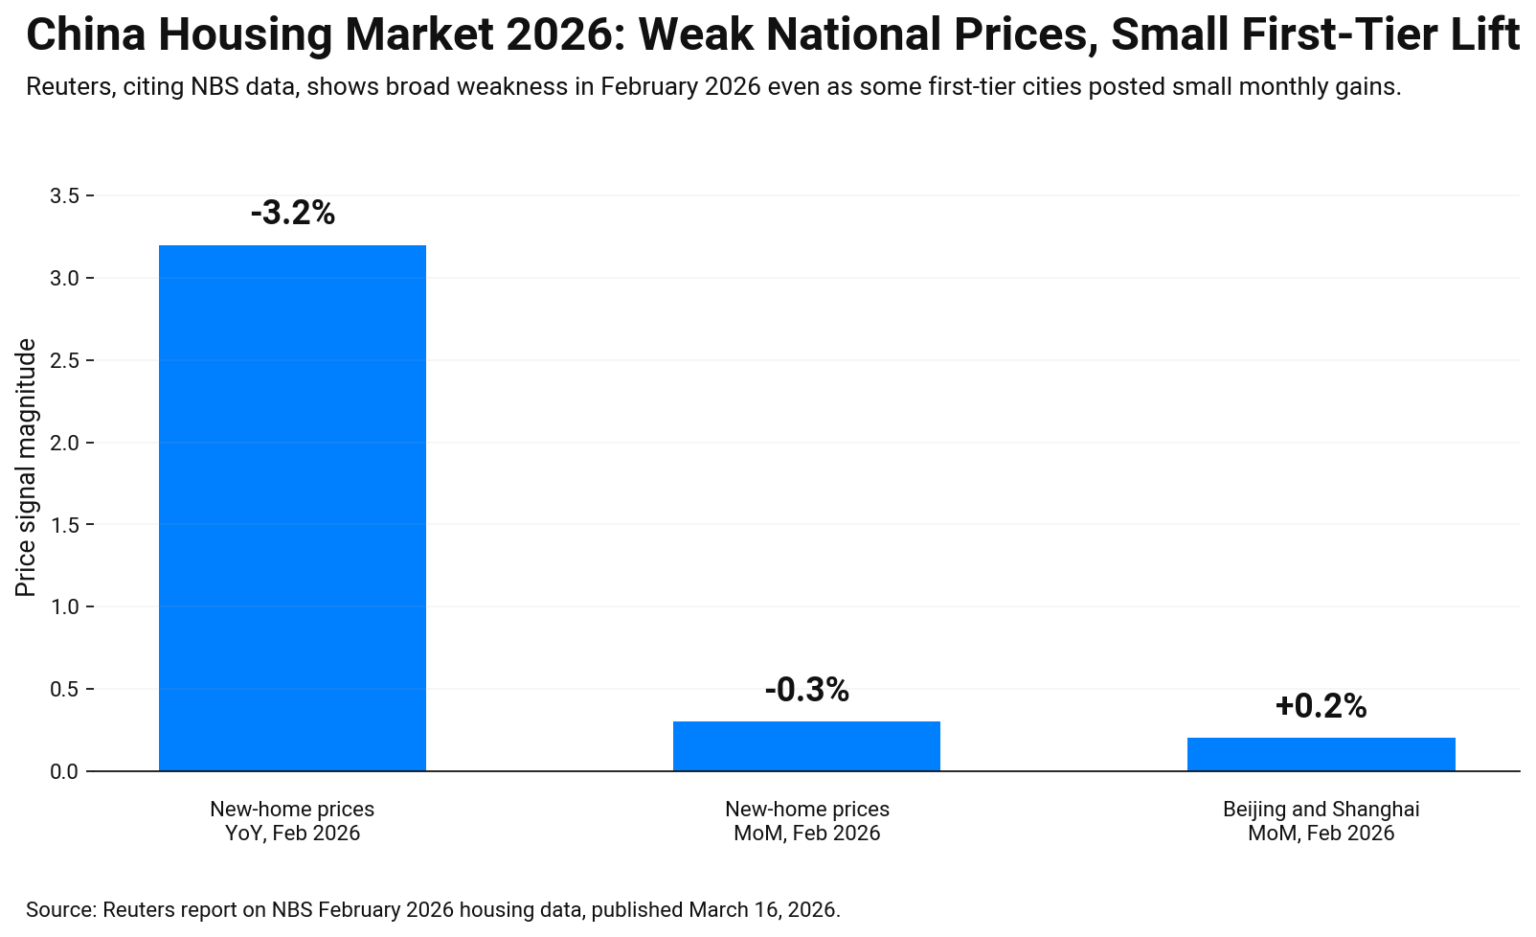
Even with that method note, the signal is clear. Reuters, citing NBS data, reports new home prices fell 3.2% year on year in February 2026, while the month-on-month drop eased to 0.3% from 0.4% in January. It notes that some first-tier cities such as Beijing and Shanghai saw small monthly gains, while lower-tier cities kept sliding. So buyers stay careful, and sellers lean on discounts. Developers push incentives to move stock.
Next, we move to South Korea, where weekly data shows how fast sentiment can still shift.
South Korean property market 2026 Q1: Seoul is rising, but the pace is cooling
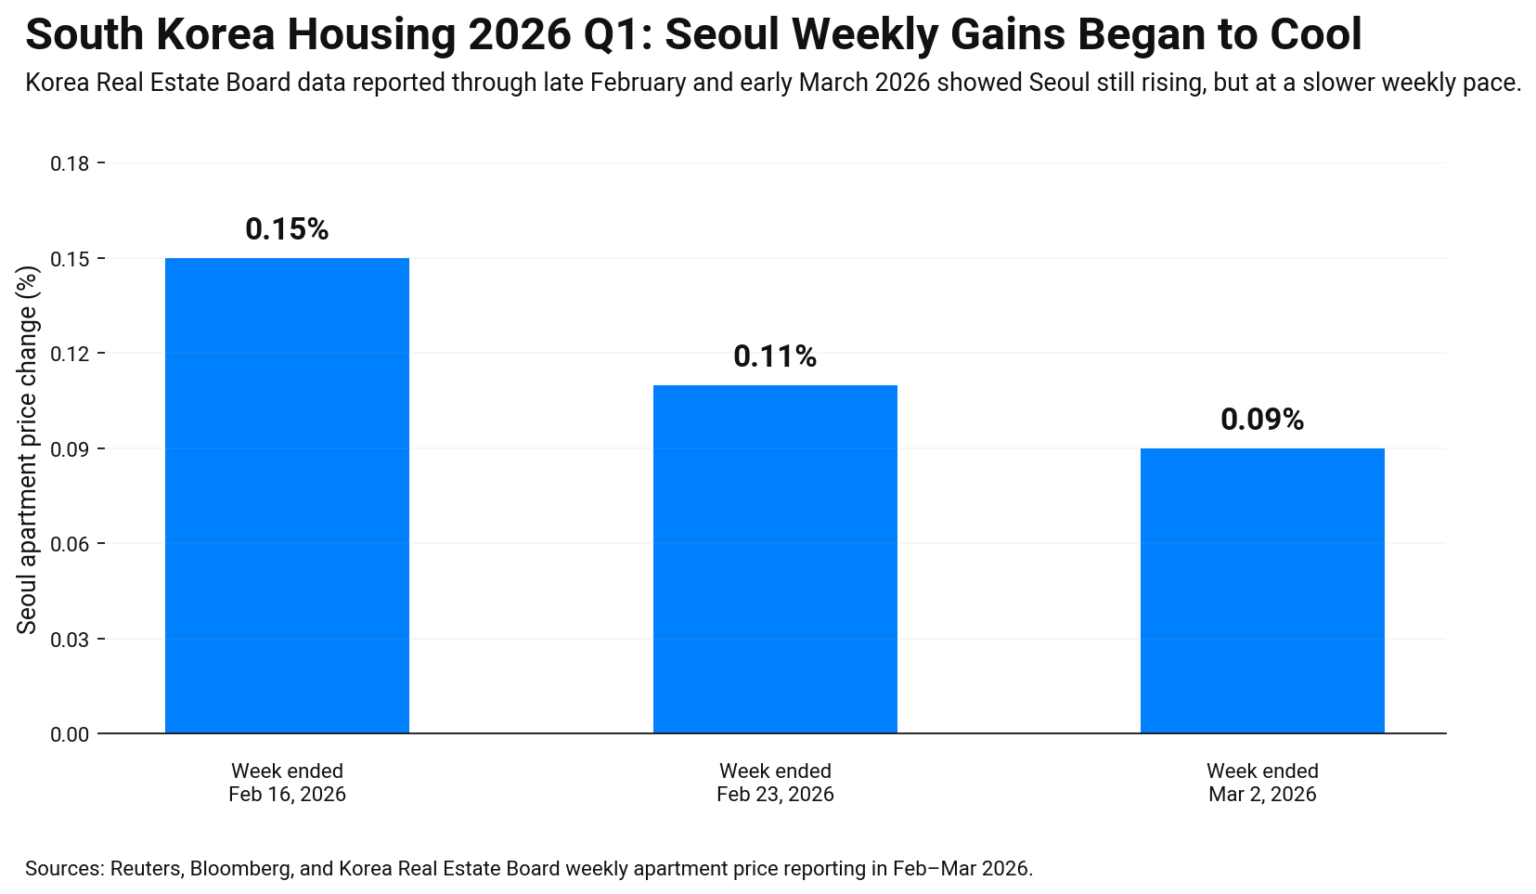
East Asia property market 2026 Q1 South Korea is easiest to follow with weekly tracking, not yearly reports. Korea Real Estate Board data is watched closely for this reason. It shows mood changes fast. One week can shift bidding, listings, and discount talk.
In early 2026, Seoul still showed week-to-week gains, but the lift started to slow. That usually happens when buyers hit payment limits. It can also happen when sellers test higher asks and then meet pushback. So the market can look strong and fragile at the same time.
Outside Seoul, the story often looks calmer. Some areas rise slowly. Others stay flat. That gap matters if you are comparing “Korea” as one market. It is not.
A simple way to read South Korea in Q1 is to watch three things together: weekly apartment price moves, loan rules, and new supply timing. When credit tightens, momentum can fade quickly.
Next, we’ll pull the four-country view together in a short East Asia summary, so the signals connect into one map.
East Asia property market 2026 Q1 summary: how Japan, Taiwan, China, and South Korea compare
East Asia property market 2026 Q1 summary is simple when you line up the same kinds of facts. Some markets rise. Some cool. Others are still healing. The key is to use the right “official” signal for each place.
| Country | Best dataset to track | Latest confirmed point (as of Q1 2026) | What it suggests in plain words |
|---|---|---|---|
| Japan | MLIT official land prices | Land prices +2.8% YoY (as of Jan 1, 2026) | Pressure is still building, but not evenly |
| Taiwan | MOI housing price index | Index 145.46, -2.15% QoQ, -2.83% YoY | A clear cooling path, with more buyer caution |
| China | NBS 70-city monthly survey | Base reset to 2025 from Jan 2026 | Monthly prints are easier to compare again |
| South Korea | KREB weekly apartment trend | Seoul +0.11% WoW (week ended Feb 23, 2026) | Still rising, but momentum is slowing |
Now connect the dots. Japan is an upward benchmark story. Taiwan is a downshift story. China is a long repair story. South Korea is a “rising, but tiring” story.
Takeaway
East Asia property market 2026 Q1 shows why one headline never fits four countries. Japan’s land benchmark is still rising. Taiwan’s index shows a steady cool-down. China remains in repair mode, with weak national prints and steadier top-city pockets. South Korea is still climbing in Seoul, yet the pace is easing. Use each country’s best official dataset, then validate with local supply and loan rules. Next quarter, watch new releases, not rumors, before you act.
East Asia property market 2026 Q1 frequently asked questions
These FAQs answer the main questions readers have after this East Asia property market 2026 Q1 report.
Which official data sources should I trust for Japan, Taiwan, China, and South Korea?
Japan: MLIT land prices. Taiwan: MOI housing price index. China: NBS 70-city monthly survey. South Korea: KREB weekly apartment trends, often cited in market reporting.
Why do these countries move so differently in the same quarter?
They have different loan rules, supply cycles, and buyer demand. Also, their “official” datasets measure different things, like land prices versus home sale prices.
Is Taiwan really declining, or is it just one quarter of noise?
The MOI index shows three straight quarterly declines since a 2024 Q4 peak, with the latest print down both quarter on quarter and year on year.
Did China change its housing price survey in 2026?
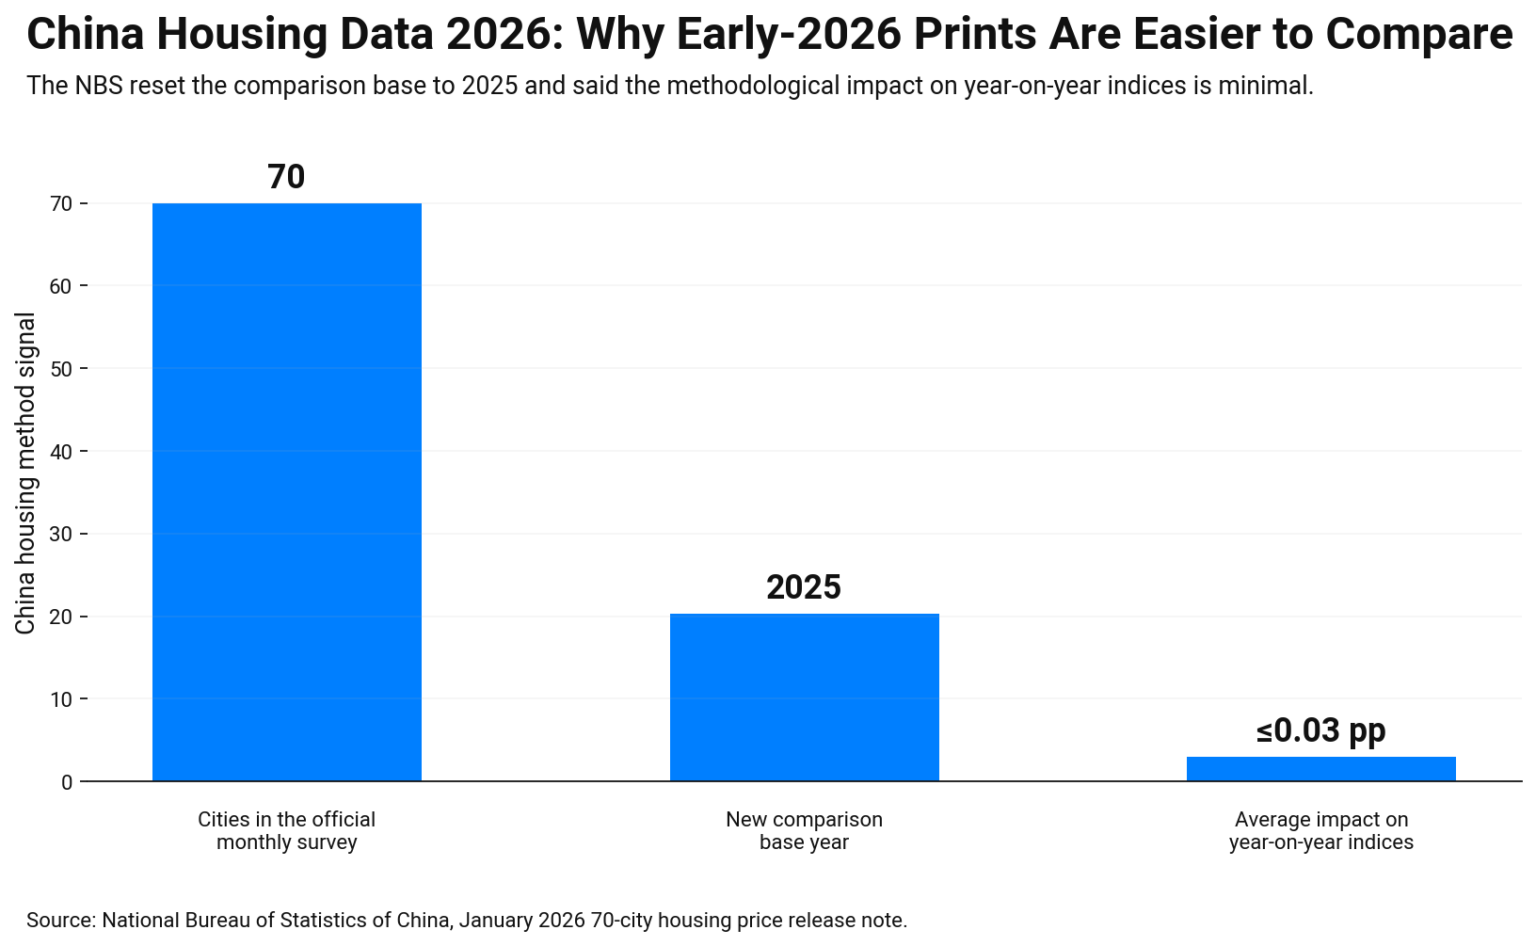
Yes. NBS reset the base period to 2025 from January 2026 and adjusted weights to reflect the sales structure, while saying the impact on YoY indices is small.
What is the quickest signal to watch in South Korea right now?
Weekly Seoul apartment price movement is a fast sentiment gauge. Recent reporting using KREB data shows increases continue, but the weekly pace has cooled.