
Oceania property market 2026 Q1: Australia and New Zealand data recap
Oceania property market 2026 Q1 is a tale of two neighbors that move in different ways. In this report, we focus on Australia and New Zealand. You will see the newest official numbers we can confirm today, plus the clearest market indicators that update fast.
We cover home values, lending pressure, and what that means for buyers and renters. We also explain why some data prints lag behind the quarter you live in. Next, we start with Australia, where values rose again in early 2026.
For the global dashboard and links to every region, see:
Oceania property market 2026 Q1 Australia: home values rise, but it’s uneven
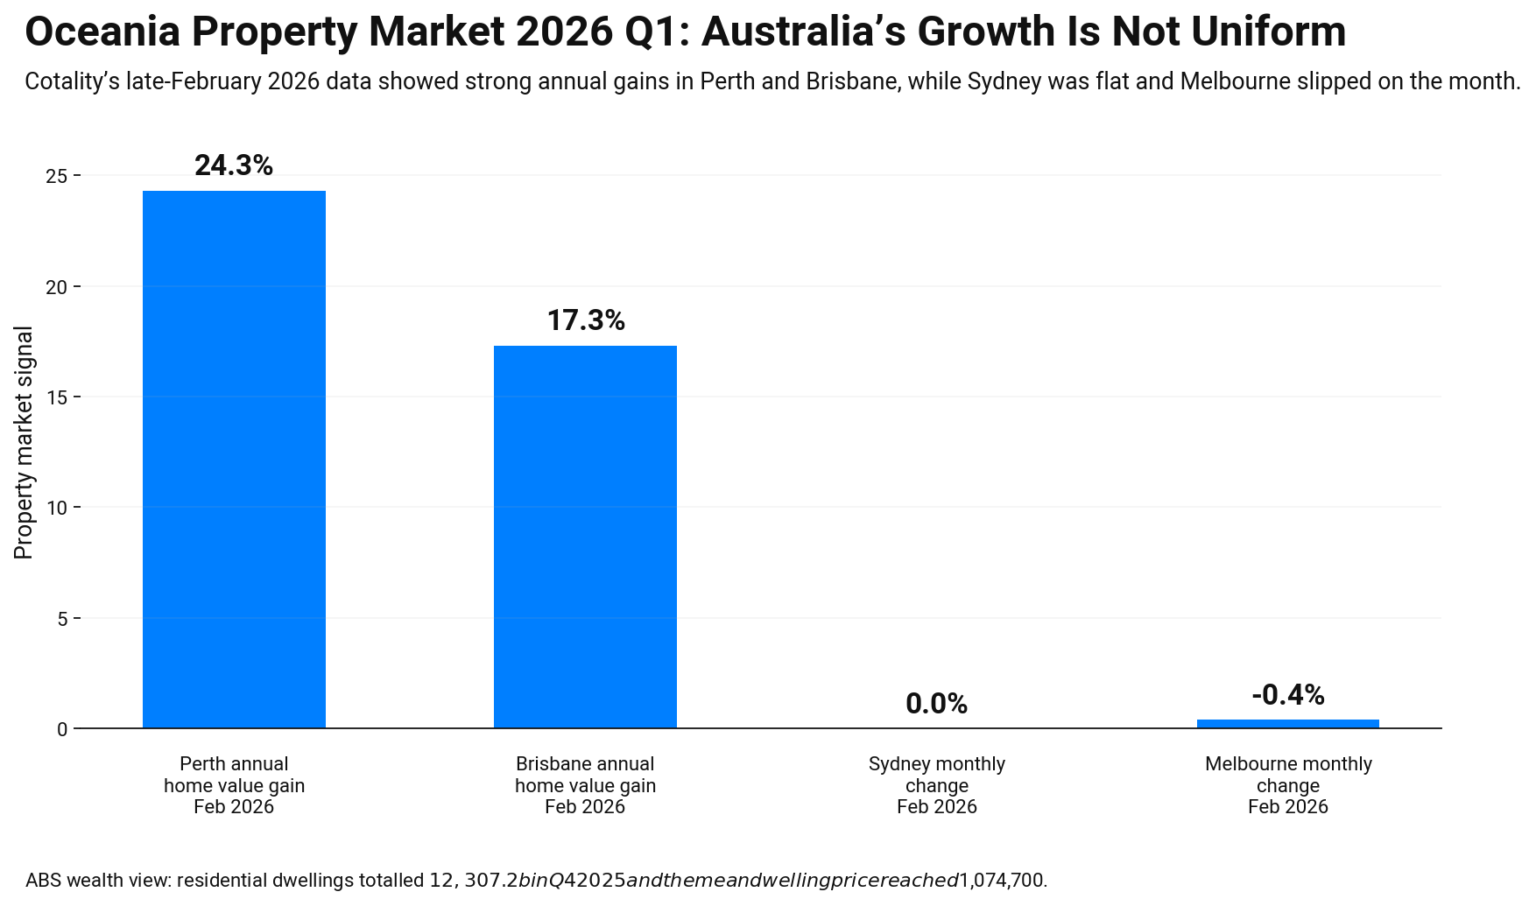
Oceania property market 2026 Q1 Australia shows growth, yet it is not uniform. Some cities push ahead. Others pause. That split matters if you only follow one national headline.
A high-frequency read comes from Cotality’s Home Value Index. It shows strong annual gains in places like Perth and Brisbane by late February 2026, while Sydney and Melbourne look flatter on the month. For a bigger “wealth” view, the ABS said the total value of residential dwellings rose to $12,307.2 billion in the December quarter 2025, and the mean dwelling price rose to $1,074,700.
Money conditions also shape demand. The RBA notes housing credit and loan commitments can lead or lag price changes because settlements and data collection take time.
Next, we move to New Zealand, where pricing and activity are often explained through sales pace and mortgage conditions.
New Zealand property market: prices edge up, but buyers move slowly
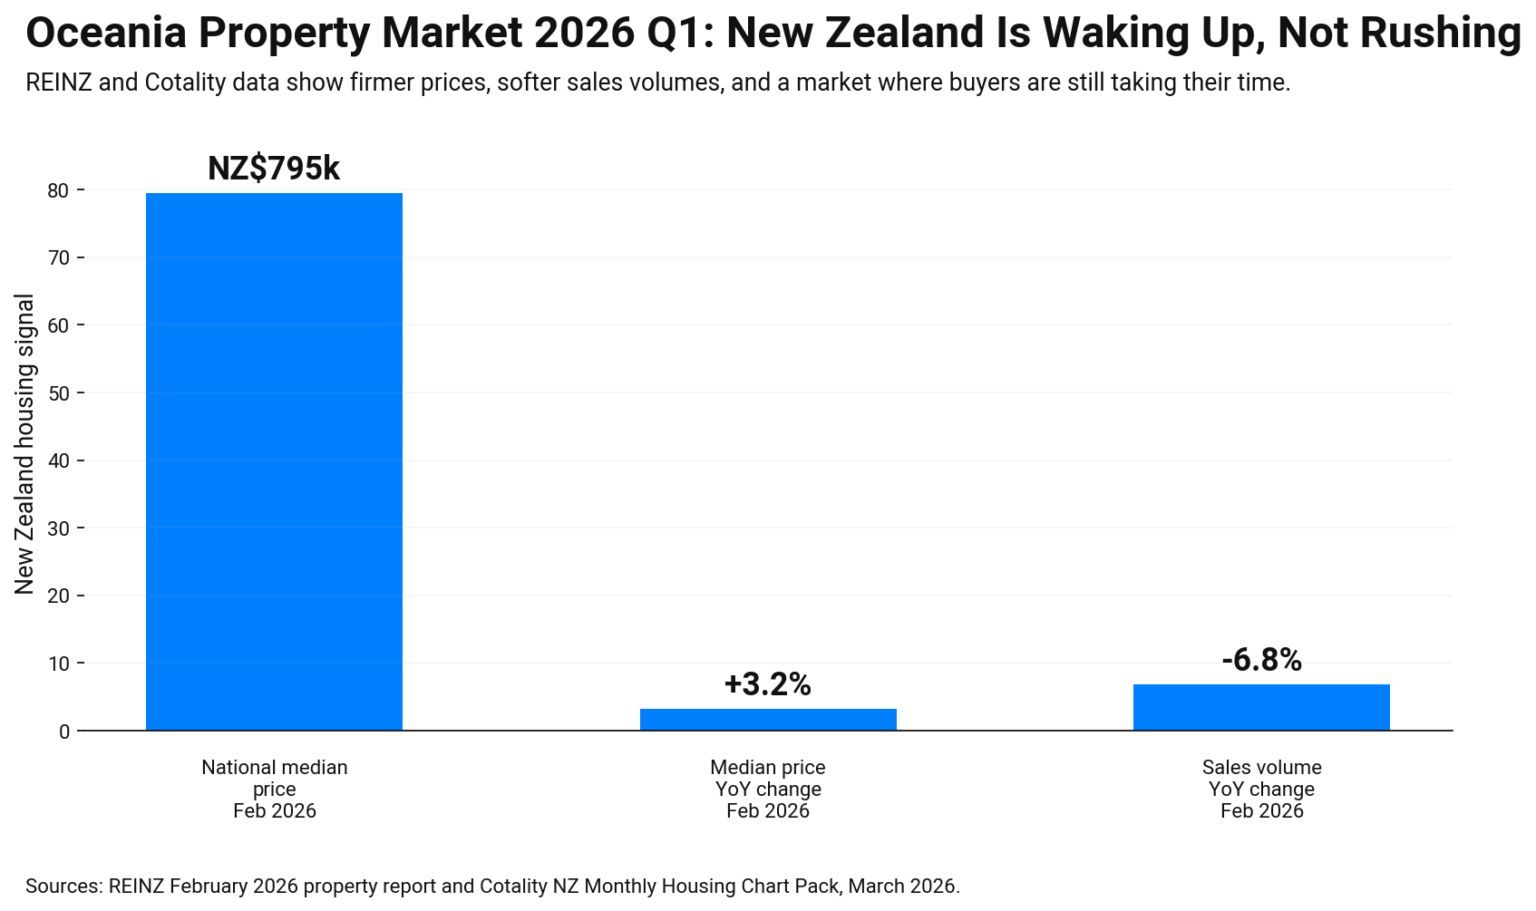
Oceania property market 2026 Q1 New Zealand looks like a market that is waking up, but not rushing. Prices are not collapsing. Sales are also not booming. So people take their time, and they wait for a deal.
REINZ says the national median price rose 3.2% year on year to NZ$795,000 in February 2026. It also notes sales were largely steady and homes took longer to sell. That points to slower decisions, even when sellers hold firm.
Cotality’s March 2026 chart pack adds another signal. It says February sales volumes were 6.8% lower than a year earlier, after a fall in January too. That supports the “patience” story.
Rates still matter a lot. The Reserve Bank of New Zealand tracks standard mortgage rates for new borrowers, which helps you see what banks are offering over time. Meanwhile, Reuters reports prices remain well below the pandemic peak and that the housing slump is holding back the recovery mood.
Oceania property market 2026 Q1 commercial and redevelopment trends: land, builds, and deal reality
Oceania property market 2026 Q1 commercial and redevelopment trends are shaped by one hard truth. Land is costly. Builds are also costly. So developers must be picky, and many sites sit longer before they move.
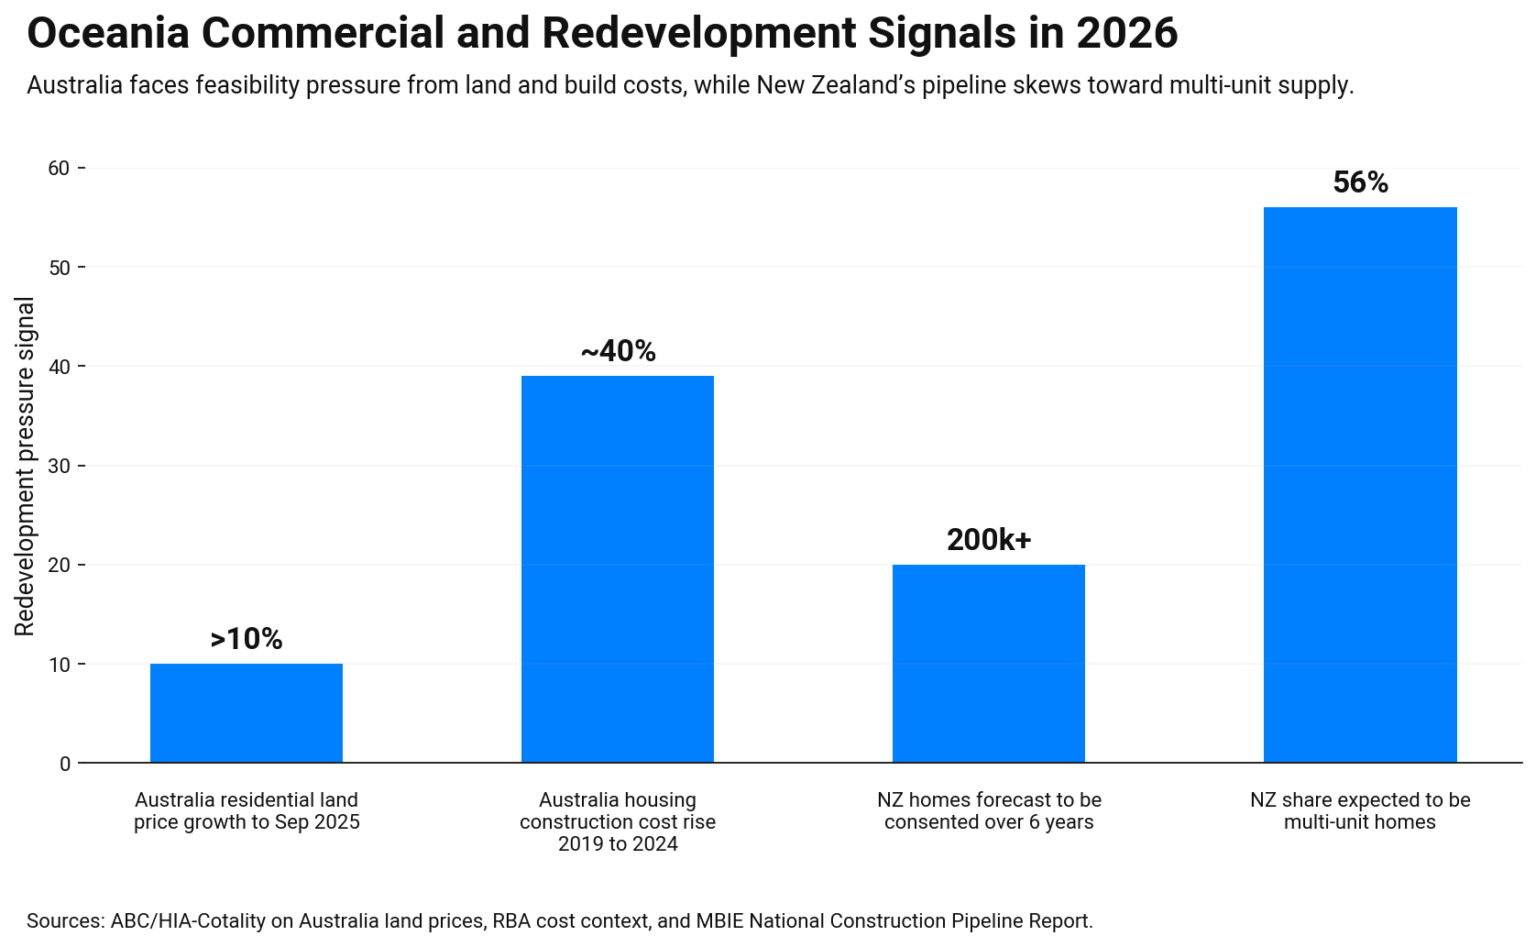
In Australia, a key block is land pricing. Reporting in February 2026 said rising land prices are a main factor holding back new housing supply, and it cited the Reserve Bank’s view that housing construction costs rose by almost 40% between 2019 and 2024. So, even if demand exists, feasibility can break fast.
Here is what that means for a land buyer looking to redevelop:
- Target sites with planning clarity, not “maybe later” zoning.
- Run build-cost stress tests before you bid, not after.
- Treat pre-leased or income-holding sites as lower risk.
On the commercial side, large research houses are framing 2026 as a cycle where income durability and asset selection matter more than easy price growth. That usually favors industrial and “needs-based” locations first, while weaker offices take longer.
In New Zealand, the story leans on pipeline and sentiment. MBIE forecasts over 200,000 homes consented over six years, with about 56% multi-unit. Bayleys also notes developer sentiment is improving and links it to rising consents.
Next, we can turn this into a short watchlist for land buyers, with simple checks for Australia and New Zealand before they make offers.
Oceania property market 2026 Q1 redevelopment watchlist: quick checks before you buy land
Oceania property market 2026 Q1 redevelopment deals can look exciting, then fail on small details. So start with a simple screen. Check planning rules first. Then check build costs. After that, test demand with real comps, not hope. Finally, map out timing, because delays can burn cash.
| Check | Australia focus | New Zealand focus | Why it matters |
|---|---|---|---|
| Zoning and overlays | Council rules, height limits, heritage | District plan rules, special zones | Stops “surprise” limits later |
| Site services | Sewer, stormwater, power capacity | Water, wastewater, access upgrades | Upgrades can blow budgets |
| Holding income | Parking, storage, small leases | Short-term lease, yard use | Lowers carrying risk |
| Build cost risk | Contractor capacity, material swings | Trade availability, consent timing | Delays change feasibility |
| Exit plan | Pre-sales, rental demand, yield | Buyer depth, rental take-up | Protects resale value |
Next, run two stress tests. Add a cost buffer. Also extend the timeline. If the deal still works, move forward.
Oceania property market 2026 Q2 trends: what may change
Oceania property market 2026 Q2 trends will likely turn on rates and supply. In Australia, the central bank said housing prices grew strongly over the past year, but growth softened at the start of 2026. If borrowing stays tight, more buyers may step back. If it loosens, auctions can heat up again in busy metro areas. Clearance rates can also signal fear early.
New Zealand may stay a slow-move market. February sales were only slightly higher than a year earlier, which fits the patience story. Rate decisions matter here too. The central bank lists key OCR dates on April 8 and May 27, 2026, and banks can reprice quickly.
Across both countries, watch land and building costs. When projects stall, rents can stay firm. When consents and builds pick up, choices widen. Next, we’ll turn these Q2 shifts into a short watchlist you can track each week.
Conclusion
Oceania property market 2026 Q1 shows two active markets, yet cautious. Australia still has value growth, but land and build costs make redevelopment harder. New Zealand is moving more slowly, with buyers taking time and sellers holding firm.
For Q2, watch rates, sales pace, and consent pipelines. Use real comps and planning checks before you bid. That is how you avoid costly surprises and pick better sites.
Oceania property market 2026 Q1 frequently asked questions
These FAQs answer the main questions people ask after reading this Oceania property market 2026 Q1 report.
Which sources should I trust for Australia and New Zealand property data?
For Australia, use ABS dwelling value statistics and Cotality’s Home Value Index for fast monthly movement. For New Zealand, use REINZ monthly data plus the RBNZ rate series.
Why do prices rise even when sales feel slow?
Supply can stay tight, and sellers may refuse discounts. Also, better homes keep selling while weaker stock sits, which can lift median numbers.
What is the biggest risk when buying land to redevelop in 2026?
Planning limits and build-cost swings. If zoning, services, or contractor capacity change, a deal that looked fine can fail on the numbers.
How can I screen a redevelopment site quickly?
Confirm zoning and overlays, then check the services capacity. After that, run build-cost and timeline stress tests, and compare exit demand with real local comps.
What should I watch first in 2026 Q2?
Track mortgage rates, sales volumes, and new consents. In New Zealand, also watch the RBNZ decisions, since banks can reprice quickly after them.