
Latin America property market 2026 Q1: Brazil, Chile, Peru, Paraguay, Argentina, and Mexico
Latin America property market 2026 Q1 is moving, but not in one direction. This report covers Brazil, Chile, Peru, Paraguay, Argentina, and Mexico. You will see which price indexes are solid, and where data is thin. We also explain what the latest releases suggest about demand, credit, and build costs. Then we flag the risks developers face when buying land. Finally, we share the main discussion themes to help you know what to verify next. Use it to plan better.
For the global dashboard and links to every region, see:
Latin America property market 2026 Q1 background: what 2025 carried into 2026
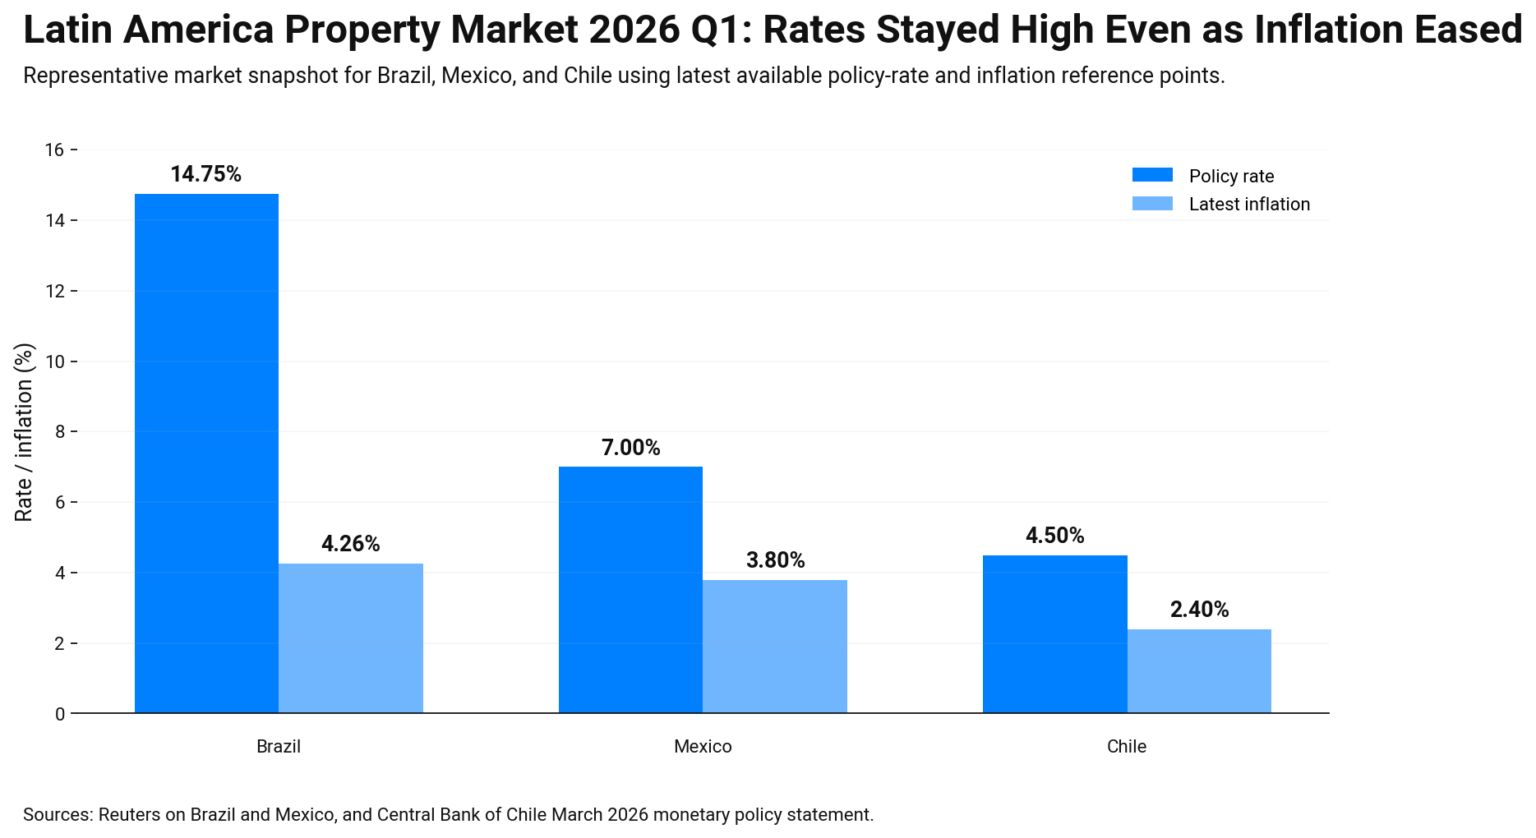
Latin America property market 2026 Q1 follows a 2025 that felt uneven. Inflation eased in some places, but prices still hurt budgets. Rates stayed high in many markets, so mortgages stayed hard to afford. That slowed sales and pushed more people into renting. Currency moves also mattered. When FX swung, building materials became harder to price, and projects paused.
In several countries, prime areas held up better than the outer zones, because buyers trusted those locations more. So Q1 2026 starts with cautious demand, tight supply in the best pockets, and more pressure to prove value and legal safety before deals close.
How we collected Latin America property market 2026 Q1 and compared the data
Latin America property market 2026 Q1 method matters because countries publish data in different ways. So we use a clear rule for each source. First, we prioritize official indexes when they exist, like Mexico’s SHF housing price index and Peru’s central bank series. Next, we use well-known market indexes when official ones are limited, like Brazil’s FipeZAP. Then we add cross-country trend lines from BIS series where available, because they help compare direction over time.
We also track timing. Many reports publish with a delay, so Q1 2026 often relies on late-2025 prints plus early signals like rates and sales pace. Finally, we review public discussions only to detect themes, such as trust worries, fee confusion, or build-cost stress. We never treat forum talk as proof. Next, we start with Brazil, where price tracking updates often.
Brazil property market 2026 Q1: what the data says about prices and demand
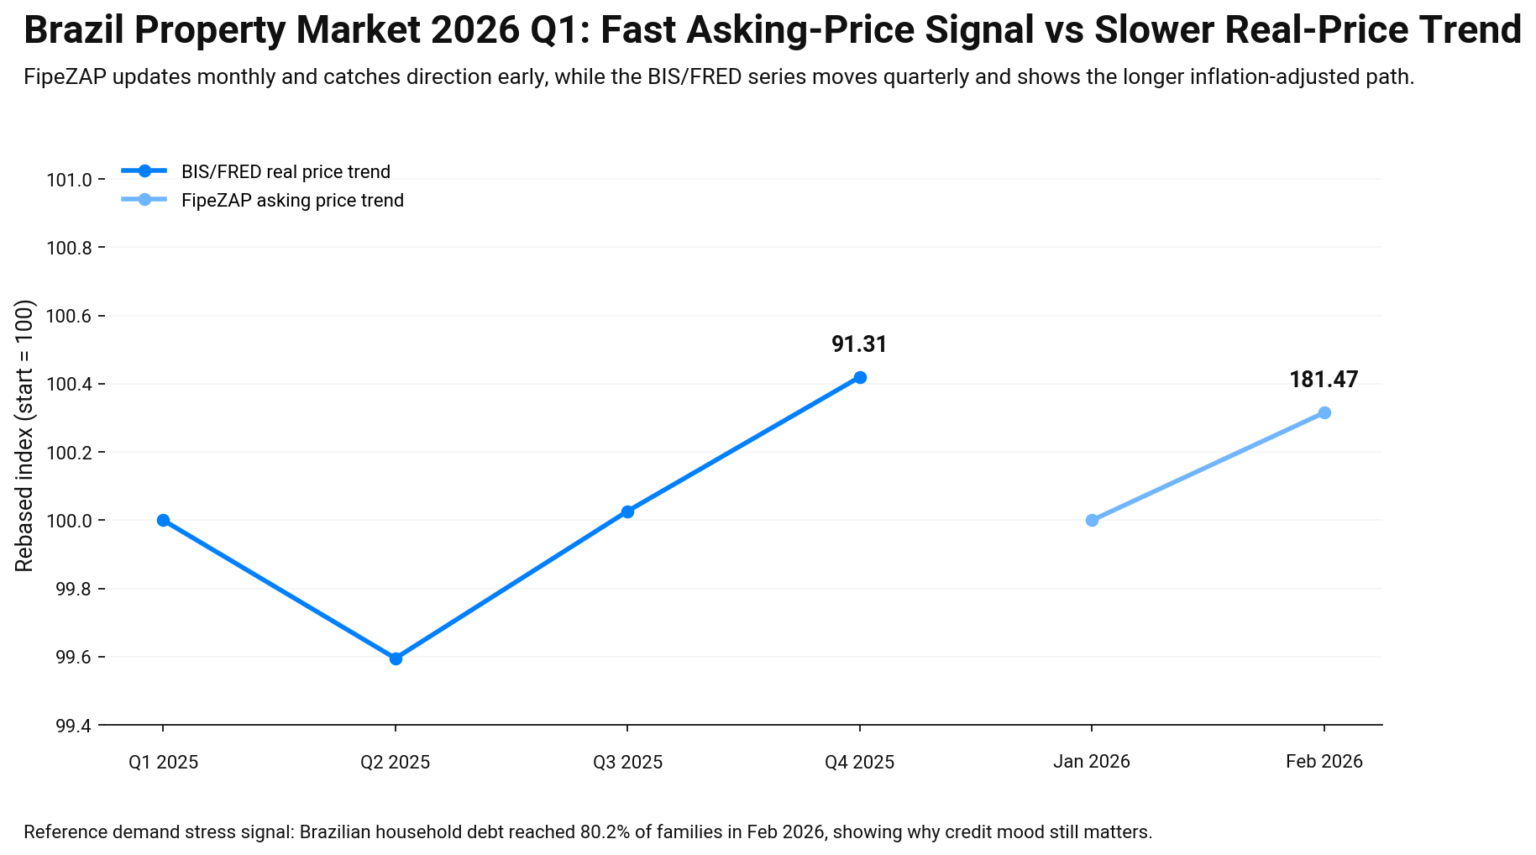
Brazil property market 2026 Q1 is one of the easiest to track, because it has a frequent price index. The FipeZAP index follows asking prices from listings, mostly for ready-to-move apartments. That makes it fast. It also means it reflects seller expectations, not only closed deals.
For a longer, comparable trend line, the BIS real residential price series on FRED helps. It is quarterly, so it moves slower. Still, it is useful when you want to compare Brazil with other countries in this report.
Here is how to read the two sources together:
| Brazil dataset | What it measures | Update speed | Best use in 2026 Q1 |
|---|---|---|---|
| FipeZAP sale + rent indexes | Listing-based asking prices (sale and rent) | Monthly | Spot direction early and compare cities |
| BIS/FRED real price index | Inflation-adjusted residential prices | Quarterly | See long-run trend without inflation noise |
| Credit and debt headlines | Household stress and borrowing mood | News-driven | Explain why demand can slow even if listings stay high |
In Q1 2026, keep an eye on credit conditions. When household debt worries rise, buyers often delay decisions, and sellers lean on promos.
Next, we move to Chile, where market tracking often focuses on new-home pricing and sales pace.
Chile property market 2026 Q1: sales pace and pricing pressure
The Chile property market 2026 Q1 is a mix of hope and pressure. Builders expect more activity in 2026. Yet budgets can still get squeezed fast. So Q1 feels like a “wait and watch” quarter.
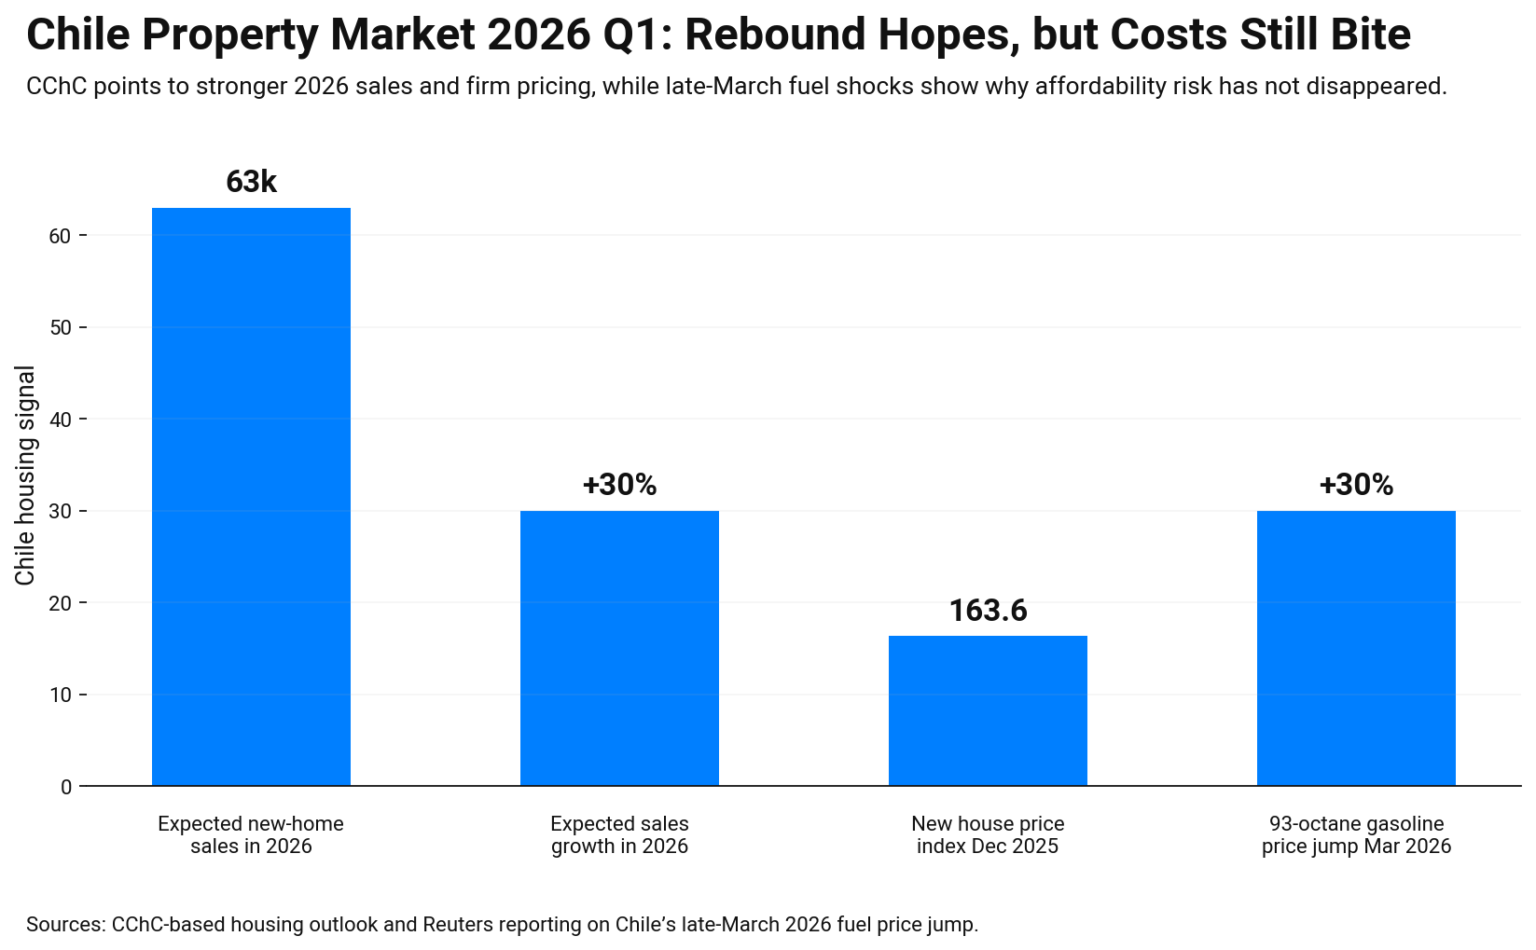
CChC shared a 2026 outlook that points to a rebound in home sales. One widely cited estimate is close to a 30% rise in new-home sales in 2026, around 63,000 units, with a stronger lift in Santiago too. For price direction, a CChC-based new house price index reached 163.6 in December 2025, which shows pricing stayed firm into the end of the year.
Then a big Q1 risk hit daily costs. Reuters reported sharp fuel price jumps in late March 2026 and warned inflation could rise in Q2. When fuel and inflation move up, mortgage comfort can drop. That can slow buying, even if listings look attractive. Next, we move to Peru, where the central bank publishes a hedonic home price series.
Peru property market 2026 Q1: the central bank index gives a clean signal
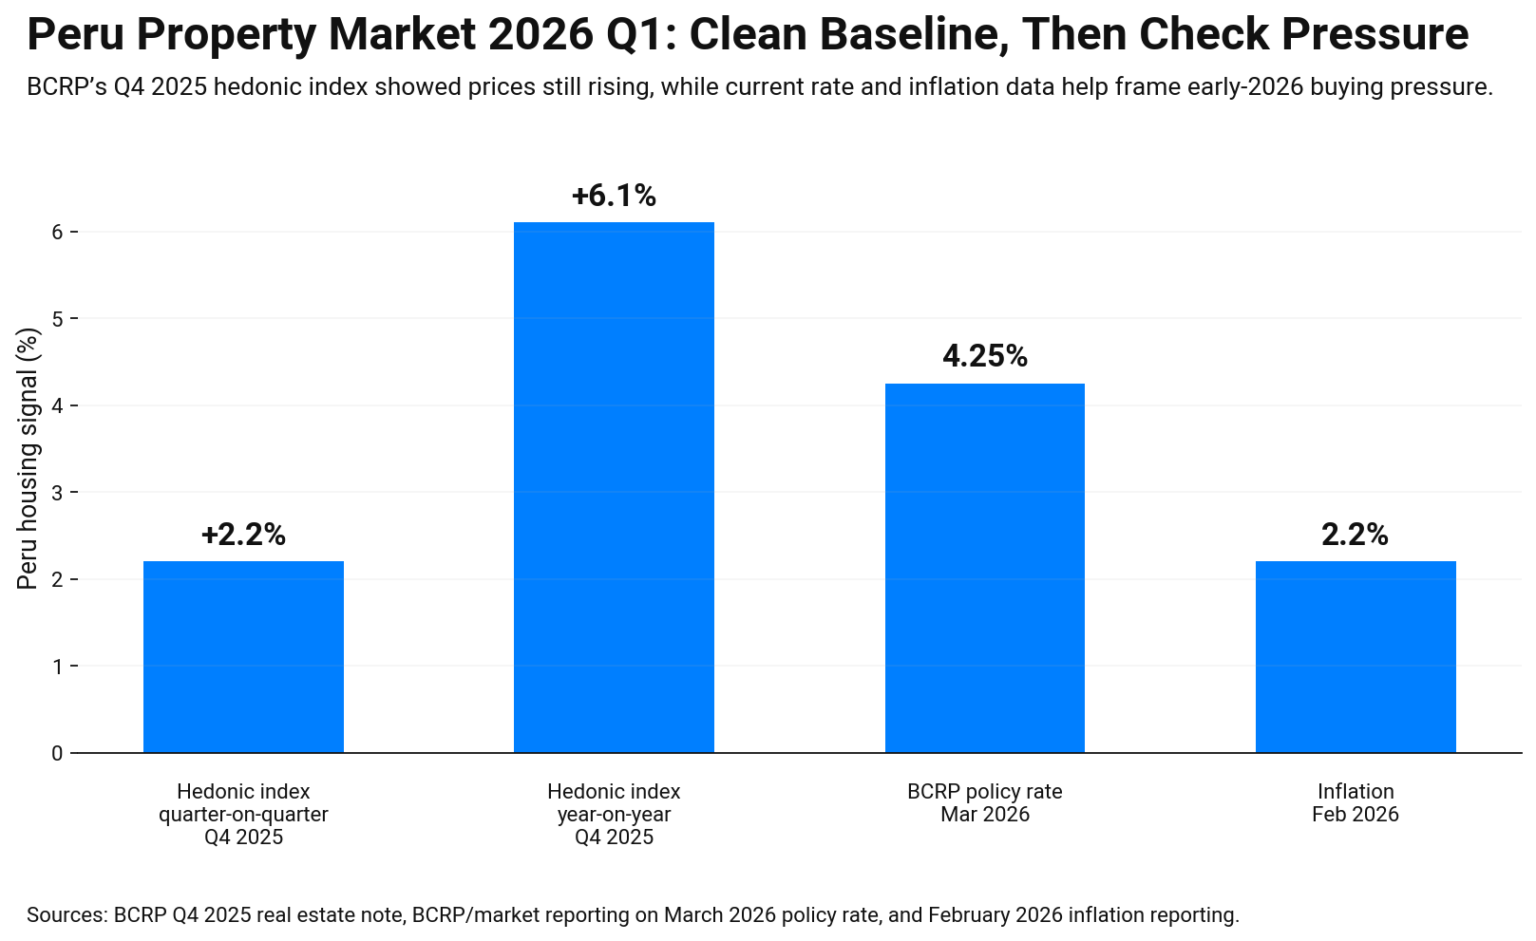
Latin America property market 2026 Q1 Peru is easier to track than many people think. Peru’s central bank (BCRP) publishes a hedonic property price index. It is quarterly, so it will not catch every short swing. Still, it is one of the cleanest sources in the region.
In March 2026, the BCRP released a note on the real estate market in Q4 2025. It said the hedonic index rose 2.2% versus the prior quarter and 6.1% versus Q4 2024. That shows prices were still rising into the end of 2025.
Use this data in a simple way. First, treat it as your baseline for early 2026. Next, compare it with local deal speed in Lima, because Peru is not one market. Then check inflation pressure too, since the index can be shown in different terms in different reports.
If you want a longer story, the same BCRP series lets you see turning points over many years. That helps you spot when growth is normal versus when it is overheating.
Next, we move to Paraguay, where the biggest challenge is not demand. It is finding one strong public price index.
Paraguay property market 2026 Q1: how to track it when price indexes are thin
Paraguay property market 2026 Q1 is tricky because there is no single, widely used public house price index that updates like Mexico or Peru. So you track the market with proxies. You also stay closer to local deals.
One helpful proxy is housing-cost inflation. TradingEconomics, citing Paraguay’s central bank, shows CPI Housing & Utilities at 120.50 in February 2026, slightly higher than January. That does not equal “home prices.” Still, it hints at pressure on rents, services, and living costs.
To keep your reading clean, use this quick set of checks:
- Track housing-related CPI for cost pressure, not sale prices.
- Follow macro outlook notes for growth and demand mood.
- Compare asking prices with closed deals in your target area.
- Treat title clarity and service access as part of the “price.”
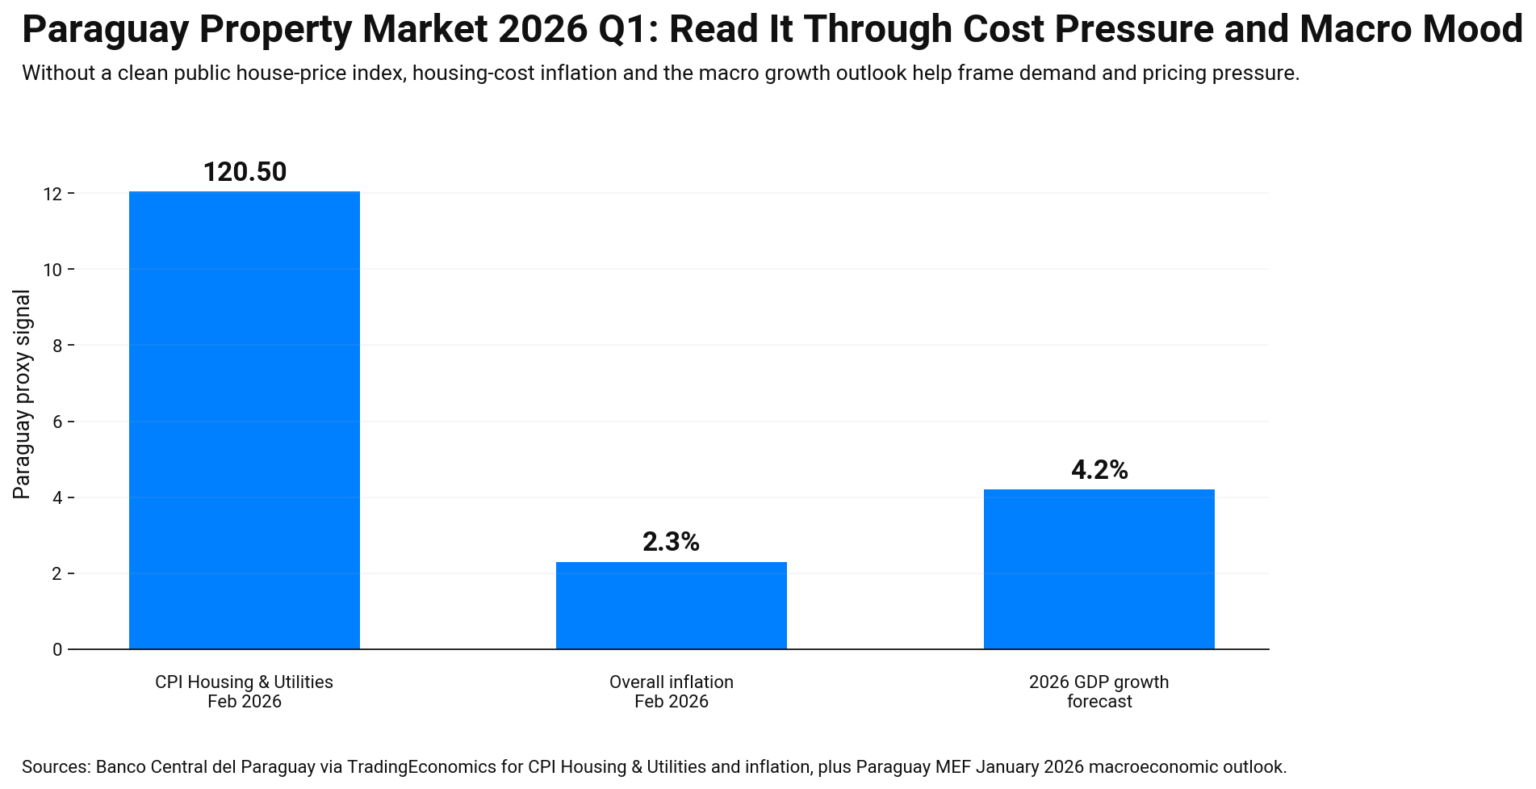
Paraguay’s Ministry of Economy and Finance outlook expects 2026 growth to pick up, driven by stronger domestic demand, which can support housing demand in active zones.
Next, we move to Argentina, where pricing is often shaped by inflation and building costs as much as listings.
Argentina property market 2026 Q1: prices are hard to track, so costs matter
Latin America property market 2026 Q1 Argentina is not easy to measure with one clean national house price index. Many deals are priced in dollars, while daily costs move in pesos. So the “real” market can look different depending on who is buying.
One solid dataset is the official construction cost index for Greater Buenos Aires from INDEC. It shows how fast materials and labor costs change. In the January 2026 release, the index rose 0.9% month on month and 67.1% year on year. That shift can rewrite a redevelopment budget.
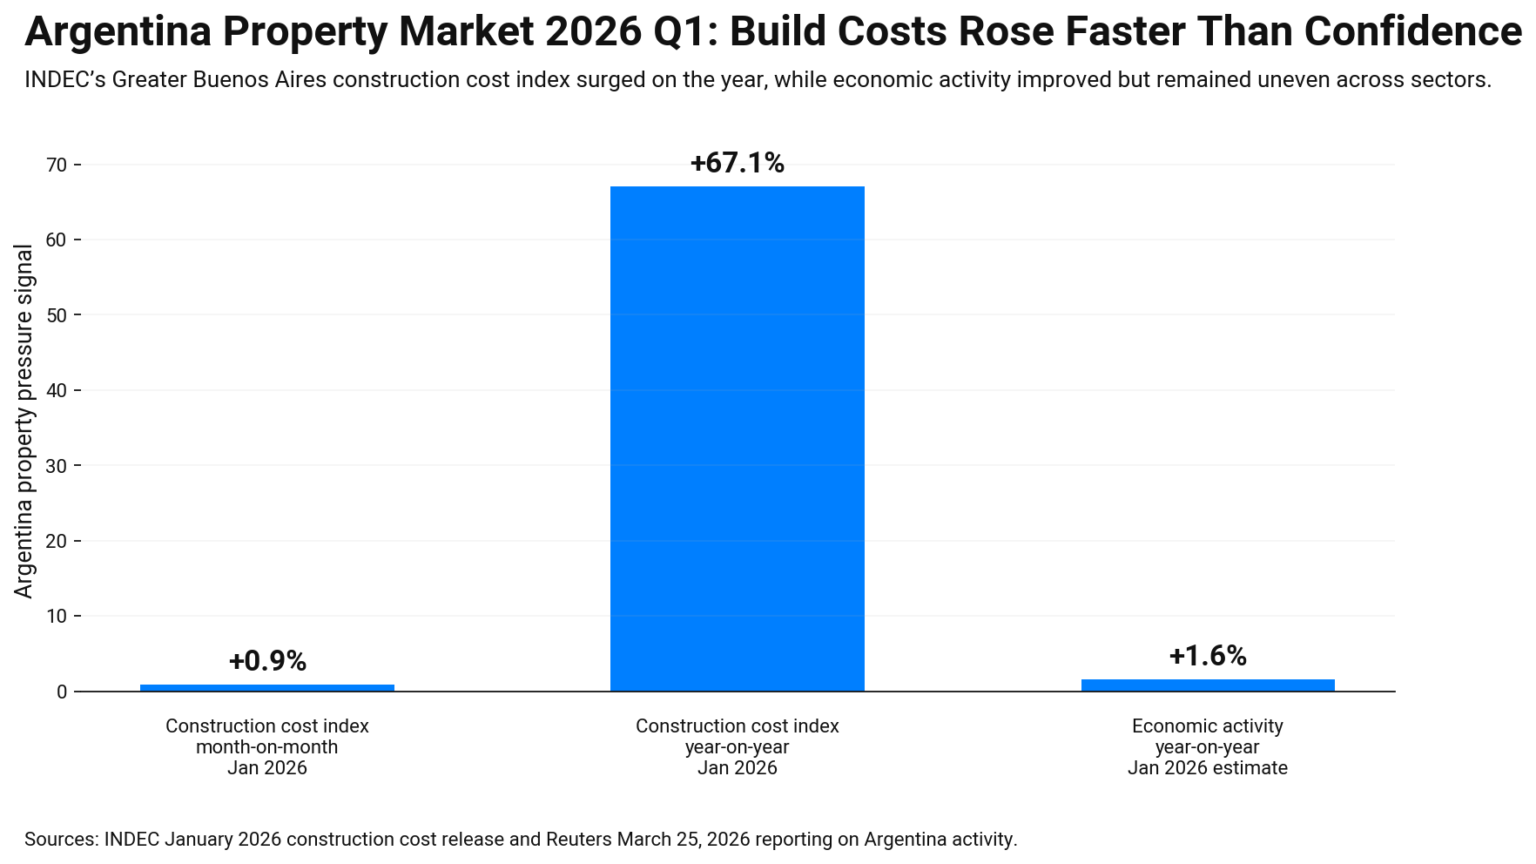
Because price tracking is uneven, watch liquidity and confidence too. Reuters reported in March 2026 that Argentina’s economic activity kept improving, but the rebound stayed uneven across sectors. When growth is patchy, housing demand often clusters in safer zones first.
So use a simple reading approach. Track build costs, check listings in your district, and confirm how payments are structured. Plan for slower resale outside prime areas. Next, we move to Mexico, where a housing price index is published.
Latin America property market 2026 Q1 Mexico: the SHF index sets the baseline
Latin America property market 2026 Q1 Mexico has a strong baseline because the SHF housing price index is widely used. The latest official summary for Q4 2025 reports 8.9% year-on-year price appreciation at the national level. That is your starting line for early 2026, since Q1 prints arrive later.
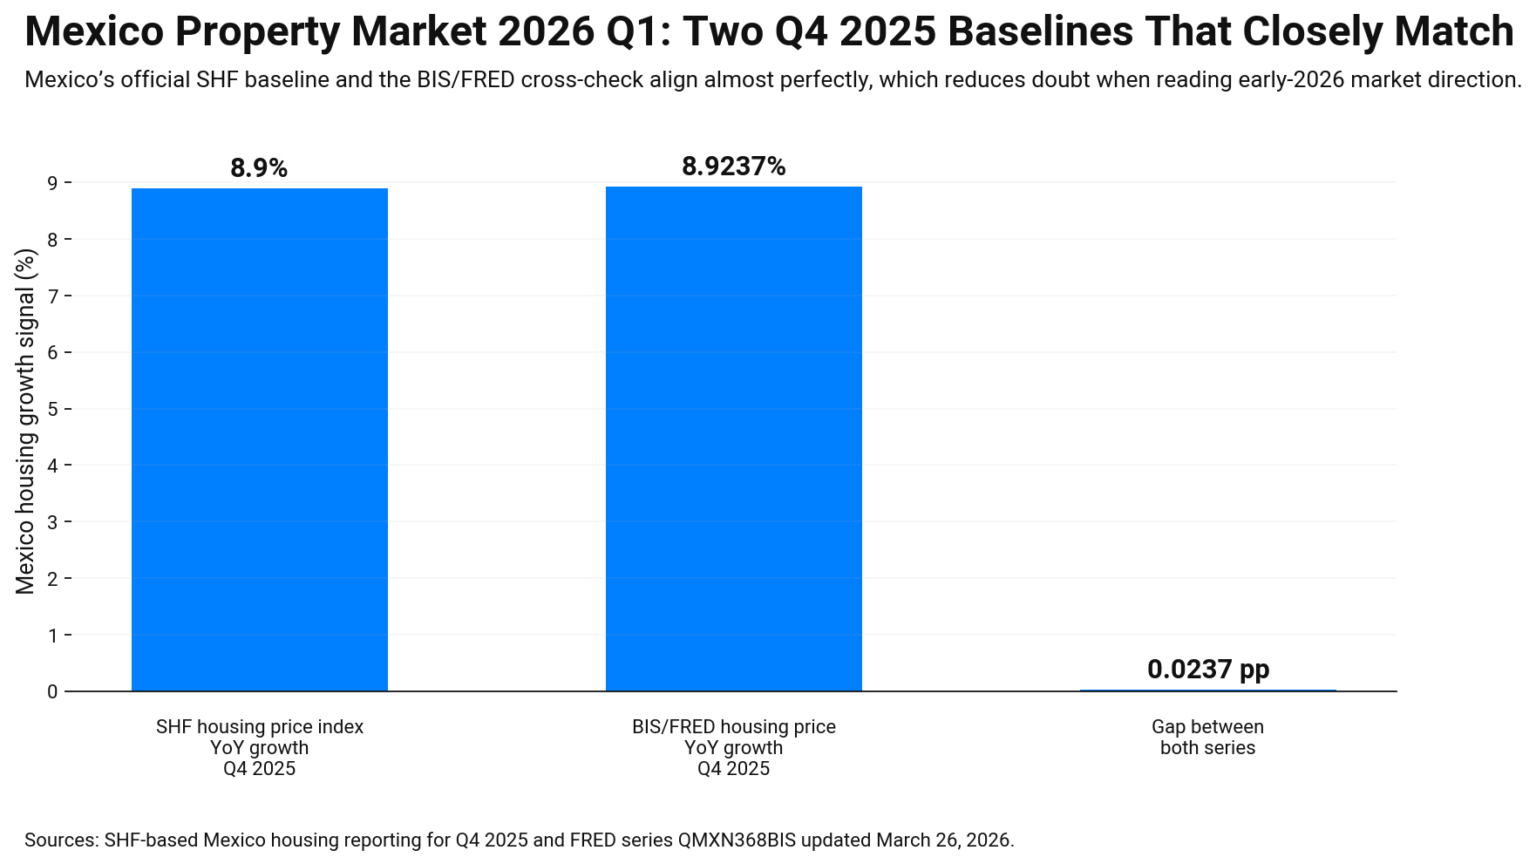
To add a clean cross-check, the BIS series on FRED shows 8.9237% (percent per annum) in Q4 2025, updated in late March 2026. The two numbers align closely, which helps reduce doubt.
Use this quick checklist when you read Mexico in Q1:
- Compare national growth with your metro’s price and rent reality.
- Separate new vs used housing, because they can move differently.
- Track deal speed and inventory, not only asking prices.
Next, we’ll summarize all six markets side by side, so the patterns are easy to compare.
Latin America property market 2026 Q1 snapshot: six markets side by side
Latin America property market 2026 Q1 is easier when each country uses one main signal. Use them for direction. Then check local deals to confirm the story.
| Country | Main signal | Latest point shown now | Q1 meaning |
|---|---|---|---|
| Brazil | FipeZAP | Monthly listing index | Fast price pulse |
| Chile | CChC index | 163.6 (Dec 2025) | Firm year-end level |
| Peru | BCRP note | Q4 2025: +6.1% YoY | Uptrend baseline |
| Paraguay | Housing CPI | 120.50 (Feb 2026) | Cost pressure proxy |
| Argentina | INDEC ICC | Latest 2026 release | Build-cost risk |
| Mexico | SHF HPI | Q4 2025: +8.9% YoY | Strong baseline |
Next, we build a Q2 watchlist that tells you which release dates, rate moves, and liquidity signals matter most in each country. You will also get a simple set of checks to spot a turn early, before quarterly indexes confirm it.
South America property market 2026 Q2 watchlist: what to track next
The South America property market 2026 Q2 watchlist starts with the release timing. Peru and Mexico publish strong official updates, but they come with a lag. So mark the next central bank and SHF releases, then compare them with what you see in listings and deals.
Next, track rates and household stress. In Brazil, credit and debt headlines can change demand fast. In Chile, fuel and inflation pressure can tighten budgets, even if prices look stable. In Argentina, build costs can jump, so feasibility can change in one quarter. Use that to decide if you build in phases or wait.
Finally, watch liquidity in your exact city. Track days on market, discounts from asking, and rental vacancy. In Paraguay, use housing-cost inflation as a proxy, then validate with local comps. If these signals turn, price indexes will usually follow later.
Conclusion: compare signals, then verify locally
Latin America property market 2026 Q1 is readable when you use the right tool for each country. Brazil moves fast in listing indexes. Peru and Mexico offer cleaner official baselines. Chile sits between pricing and cost shocks. Paraguay needs proxies. Argentina demands build-to-cost discipline. Use the table to compare direction, then verify titles, fees, and deal speed in your target city before you commit.
Latin America property market 2026 Q1 frequently asked questions
These are the Latin America property market 2026 Q1 FAQs, which answer the main questions readers ask.
Which country has the most reliable price index for this report?
Mexico and Peru are the cleanest for official price tracking. Mexico has the SHF housing price index, and Peru has the BCRP hedonic index series and market notes.
Why do Brazil numbers move faster than others?
Brazil’s FipeZAP is listing-based and updates often, so it reacts quickly. It reflects asking prices, so it can shift before the closed-sale data confirms it.
How should I read Chile in early 2026?
Use the CChC-based housing index for trend direction, then watch cost shocks like fuel prices, which can tighten budgets and slow buying even when listings look stable.
What is the best way to track Paraguay without a strong house price index?
Use housing-cost inflation as a proxy, then validate with local closed deals and rent levels in your target area. Also treat title clarity and services as part of the “true price.”
Why does Argentina need build-cost tracking in Q1 2026?
Construction costs can change quickly and reshape feasibility. INDEC’s construction cost index helps developers price risk before committing to land or redevelopment.