
Middle East property market 2026 Q1: UAE, Israel, Qatar, Saudi Arabia, and Turkey
Middle East property market 2026 Q1 is moving fast, but each country plays by different rules. In this report, we cover the UAE, Israel, Qatar, Saudi Arabia, and Turkey. You will see the latest official price indexes we can confirm today, for practical decisions, plus what they hint at about demand and supply.
We also explain where data comes from, monthly versus quarterly, so you do not mix timelines. Then we add a few real-world signals, like sales and transactions, to ground the numbers. Next, we start with the UAE and Dubai’s index.
What 2025 carried into 2026 for Middle East property market
The Middle East property market 2026 Q1 follows a 2025 shaped by rate pressure, uneven supply, and fast shifts in sentiment. In several places, prime areas stayed firm while weaker stocks needed incentives.
Off-plan sales stayed important in Dubai, so the mix effects mattered for prices. In markets with tighter credit, buyers watched payments more than headlines. Build costs and permit timelines also stayed key constraints, so some projects delayed their launches. As a result, Q1 2026 starts with cautious demand in some cities, steady activity in others, and a stronger need for verified data before making decisions.
For the global dashboard and links to every region, see:
How we qualified Middle East property market data
While collecting the Middle East property data, we followed one key rule: trust primary sources first. We use official datasets and central bank indexes, like Dubai Land Department, Qatar Central Bank, and GASTAT.
Then we cross-check with reputable reporting only when it cites those sources. We also mark the update speed, since monthly data can move before quarterly prints. If a series is city-level, like Dubai, we label it as Dubai, not “UAE.” Forums are used only to spot themes, not facts.
Middle East property market 2026 Q1 UAE: Dubai leads with clear price data
Middle East property market 2026 Q1, UAE is the easiest to anchor in Dubai, because the Dubai Land Department publishes an open Residential Sales Price Index (RPPI). It is available by month, quarter, and year, so you can track direction without guessing. Still, remember this index reflects Dubai, not all emirates.
For early-2026 momentum, Reidin reports Dubai’s residential sales price index rose 0.75% month on month and 11.79% year on year in January 2026. Rents also rose, up 0.63% on the month and 4.67% on the year. In February 2026, Reidin shows sales prices up 0.71% MoM and 10.79% YoY, while rents rose 1.26% MoM and 5.21% YoY.
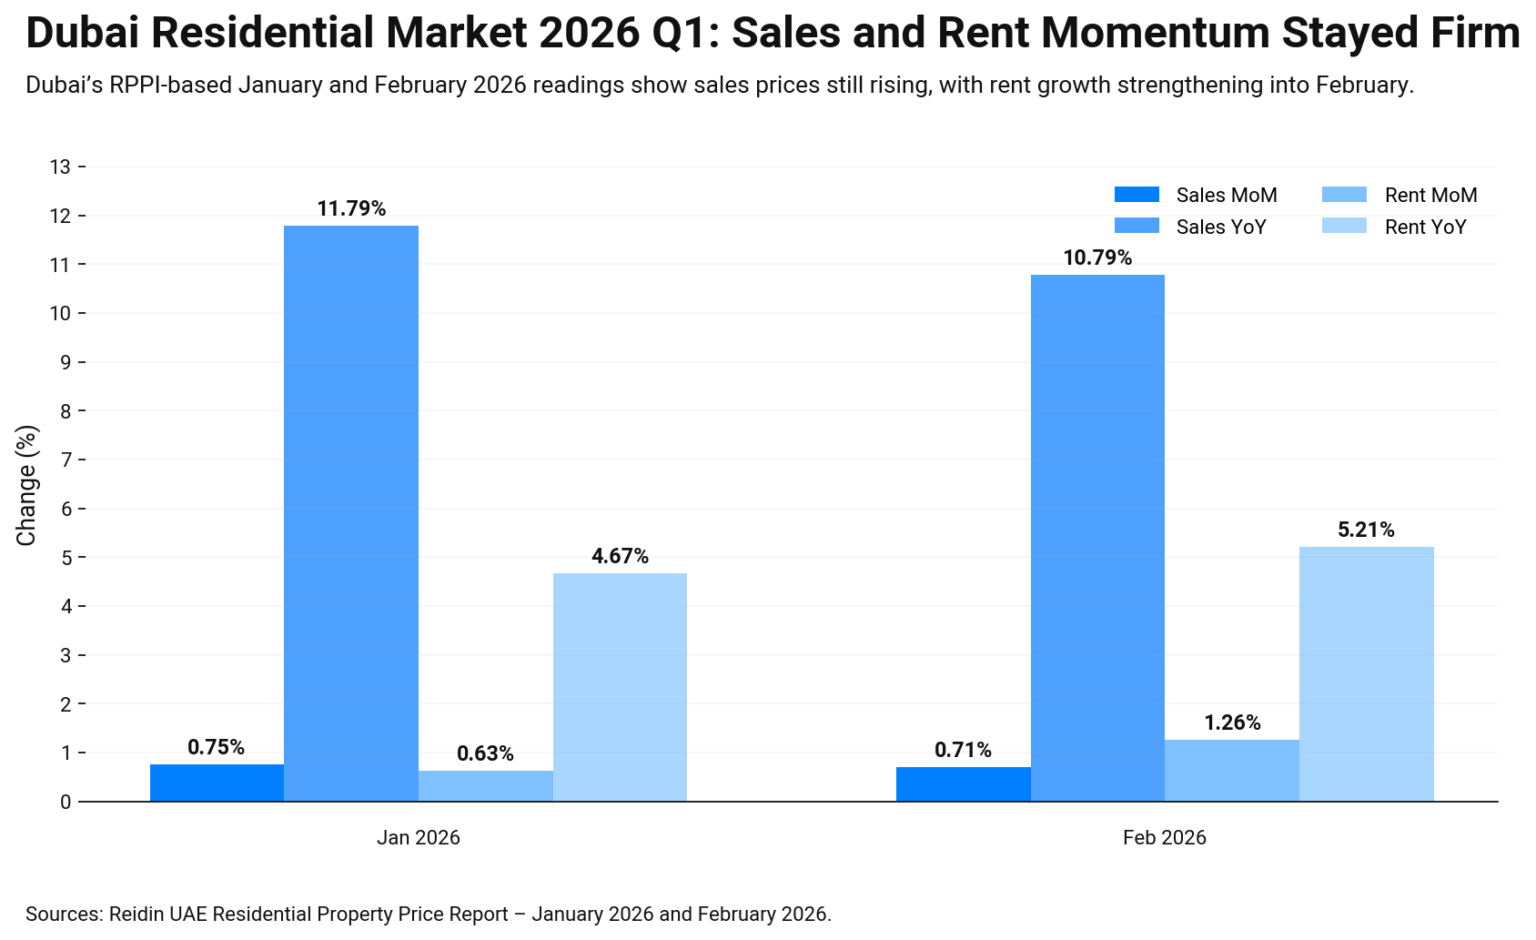
So Q1 starts firm, but is still sensitive to transaction mix. That split can lift prices even when new supply looks high. Check how much is off-plan versus ready, and watch mortgage activity in the DLD datasets. Next, we move to Qatar, where a central bank index is updated monthly for the whole country.
Qatar property market 2026 Q1: monthly index plus deal flow
Middle East property market 2026 Q1 Qatar is one of the cleanest reads, because the Qatar Central Bank publishes a national Real Estate Price Index built from Ministry of Justice data. It updates monthly, so it catches shifts faster than many quarterly reports.
| Qatar signal | Jan 2026 | Feb 2026 | Why it matters |
|---|---|---|---|
| QCB Real Estate Price Index | 224.19 | 227.82 | Shows price direction month to month |
| Real estate trading value | QAR 1.732bn | QAR 2.709bn | Shows deal flow and liquidity |
The index rose from January to February, and deal values climbed too. That usually means buyers are still active, not frozen. Use this as a pulse, then confirm with mix and mortgage volumes, because credit can amplify or mute demand. Still, check where activity sits. In February, QNA notes price-per-square-foot ranges by municipality, so “Qatar” can hide big local gaps.
Next, we move to Saudi Arabia, where the official real estate price index recently showed a year-on-year decline.
Saudi Arabia property market 2026 Q1: official index shows a softer print
The Saudi Arabia property market in 2026 Q1 is best tracked through GASTAT’s Real Estate Price Index. It is quarterly, so it will not show every short shift. Still, it is the clean official baseline for prices across segments.
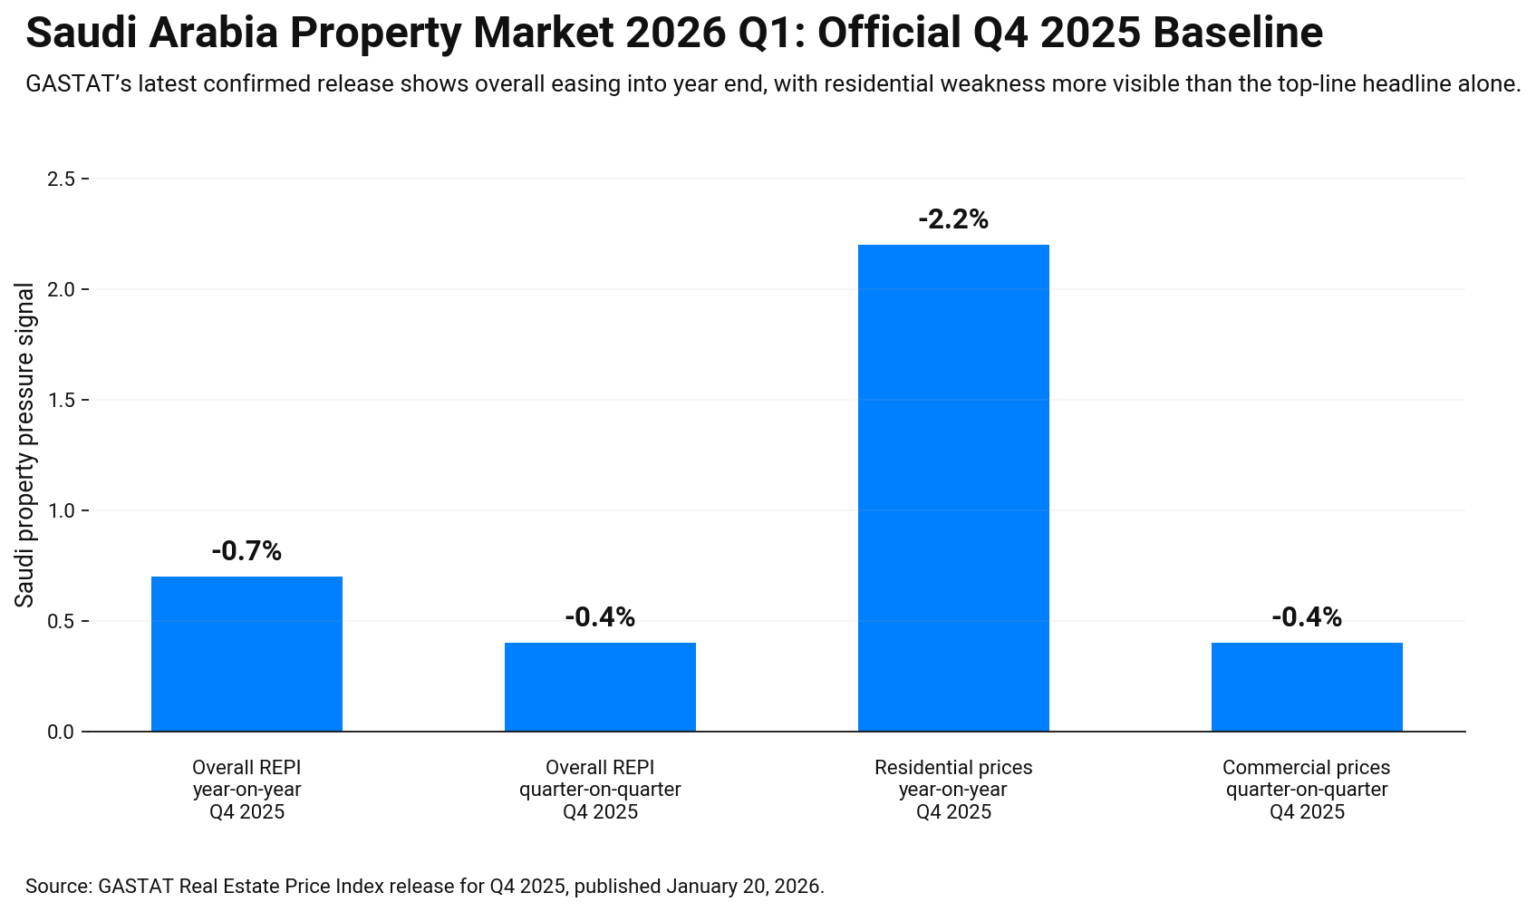
The latest confirmed update is Q4 2025. GASTAT reported the real estate price index fell 0.7% year on year, and it also fell on the quarter. That suggests pricing pressure eased into year end, even if some local areas stayed firm.
For Q1 2026, the key is the next print and the segment split. If residential stays weak while commercial holds, the story is demand-specific, not market-wide. Also watch financing comfort, because rate changes can quickly shift a buyer’s ability. Next, we move to Israel, where monthly moves can look small, but policy and supply can change sentiment fast.
Israel property market 2026 Q1: small gains, big debates
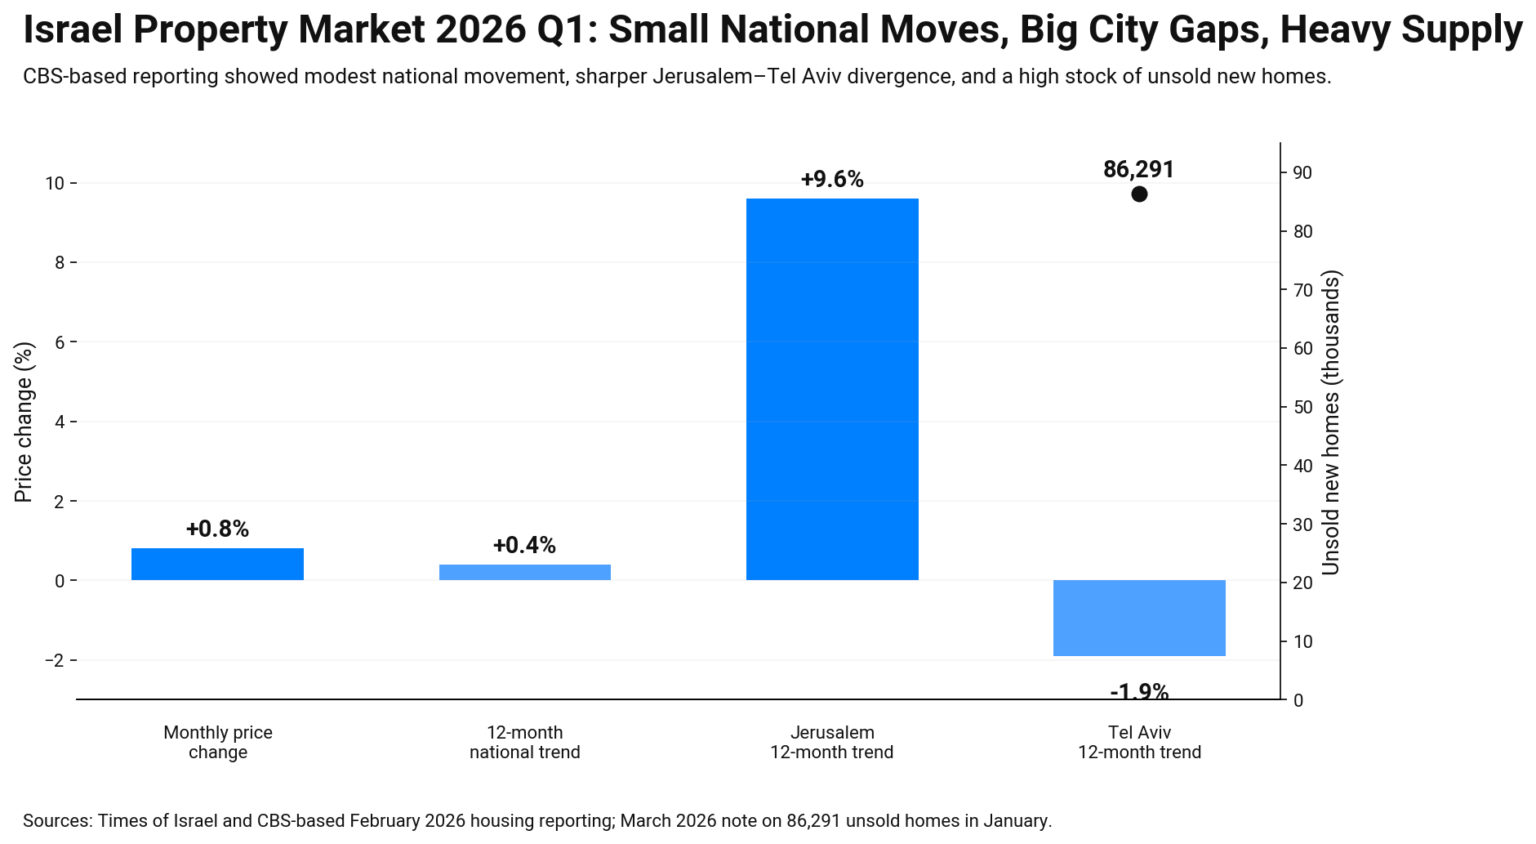
Israel property market 2026 Q1 is showing modest price movement, yet the talk is loud. The Times of Israel, citing the Central Bureau of Statistics, says the housing price index rose 0.8% in December and home prices were up 0.4% over 12 months.
People also argue about “where” the market is moving, not only “if.” One February 2026 report notes a split by city lines, with Jerusalem up 9.6% over 12 months while Tel Aviv fell 1.9%.
When you read Israel in Q1, focus on these checks:
- Monthly index change and the 12-month trend.
- Unsold new-home stock, since supply can shift bargaining power.
- Mortgage comfort and policy steps that change demand quickly.
Supply is a topic. A March 2026 note says unsold homes hit 86,291 units in January.
Next, we move to Turkey, where an official price index is updated often, and sales data adds a second layer.
Turkey property market 2026 Q1: prices rise, sales turn softer
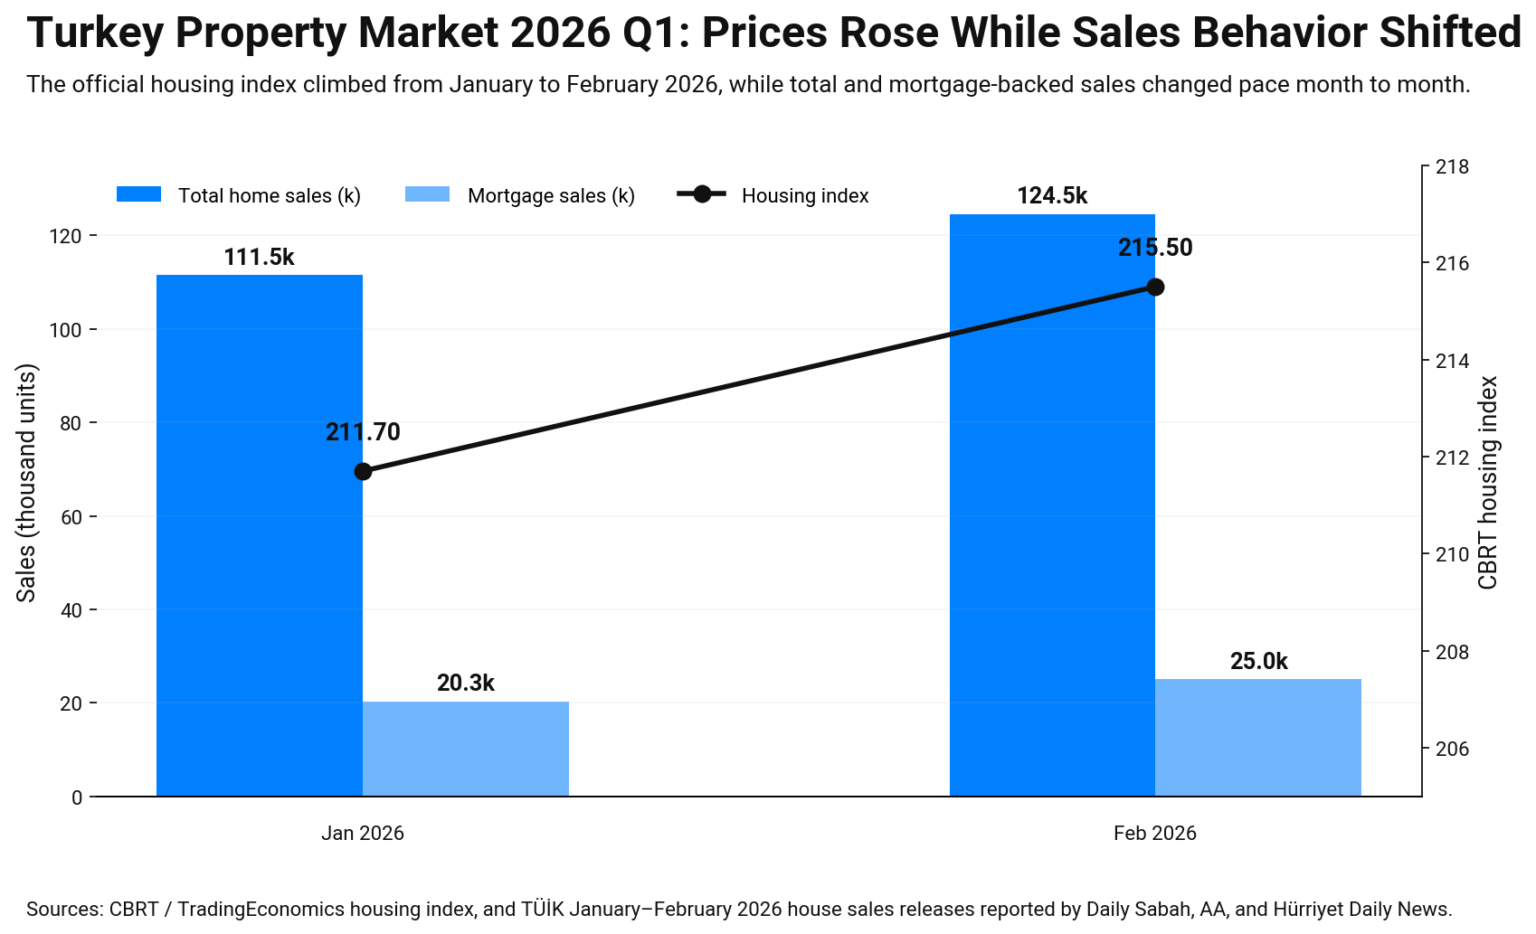
The Turkish property market 2026 Q1 is best tracked through the CBRT Residential Property Price Index. It updates often and gives a clear direction line. TradingEconomics, citing CBRT, shows the housing index at 211.70 in January 2026 and 215.50 in February 2026.
Price direction is only half the story. Sales pace tells you how buyers behave. Daily Sabah reported that home sales in Türkiye fell 5.2% year on year in January 2026 to 112,173, after a stronger stretch before. It also said mortgage sales were down 23.6% year on year, which points to tighter affordability.
So Q1 reads like this: index rising, but deal flow cooling. That can happen when inflation pushes nominal prices up while real budgets stay stressed.
Middle East property land cost, permits, and exit speed
Middle East property market 2026 Q1 redevelopment trends start with land pricing, because land sets the floor for every project. In Dubai, DLD open data helps you track price and sales movement, which supports more grounded feasibility checks before bidding on plots. In Qatar, the central bank real estate price index rose from 224.19 in Jan 2026 to 227.82 in Feb 2026, which supports confidence in prime areas where demand stays active.
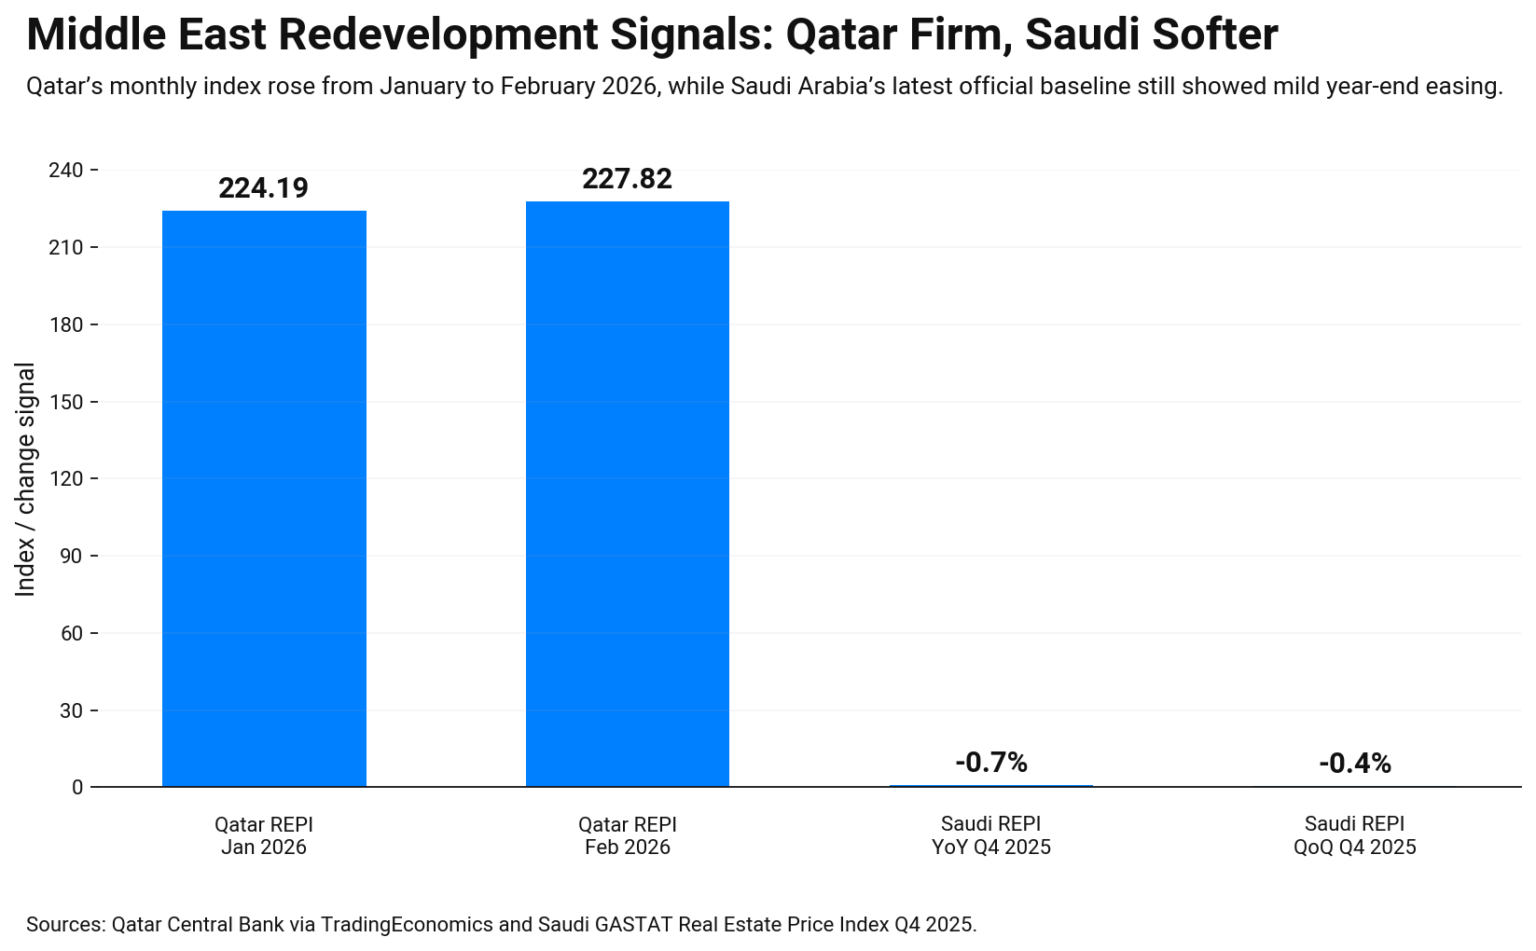
Still, land value alone is not enough. Permits, zoning limits, and services capacity decide whether a plan is even buildable on budget. Then you test exit speed. Use closed deals, transaction values, and mortgage comfort, not only listing prices. In Saudi Arabia, the official real estate price index fell 0.7% year on year in Q4 2025, so a developer may price more downside into land bids until the next release confirms the trend.
Middle East property market 2026 Q1 comparison: what the key indexes show side by side
The Middle East property market 2026 Q1 comparison works best when you line up the same kind of facts. Some markets publish monthly indexes. Others move more slowly. That difference can change how you read “Q1” headlines.
| Country | Best public signal | Latest point used here | Update speed | What it suggests |
|---|---|---|---|---|
| UAE (Dubai) | DLD RPPI + open data | Dubai RPPI dataset | Monthly / quarterly | Clear, trackable pricing |
| Qatar | QCB real estate price index | 224.19 (Jan) → 227.82 (Feb) | Monthly | Upward short-term pulse |
| Saudi Arabia | GASTAT REPI | Q4 2025: -0.7% YoY | Quarterly | Softer into year-end |
| Israel | CBS via recent reporting | Dec: +0.8% MoM; +0.4% YoY | Monthly-style | Mild growth, city split |
| Turkey | CBRT index + sales data | Feb index higher; Jan sales down | Monthly + activity | Prices up, demand softer |
Now connect the dots. UAE and Qatar give faster “pulse” reads. Saudi Arabia is slower, but cleaner. Israel and Turkey can show price gains while demand stays fragile.
Conclusion: use the right signal for each country
Middle East property market 2026 Q1 is not one trend. Dubai and Qatar offer fast index reads, so you can track shifts early. Saudi Arabia gives a slower, official baseline that can confirm a turn later. Israel looks mild overall, yet cities can move very differently. Turkey shows rising prices, but softer sales. Use these signals together, then verify locally with deal speed, fees, and financing before you commit.
Middle East property market 2026 Q1 frequently asked questions
These are the Middle East property market 2026 Q1 FAQs, which answer the main questions readers ask.
Which countries have the most reliable and frequent property price data?
Dubai and Qatar are strong for fast-tracking. Dubai has an open price index dataset, and Qatar’s central bank publishes a monthly real estate price index.
Why do some markets look strong while sales feel slow?
Prices can rise from transaction mix, inflation, or limited prime supply. Sales can slow at the same time when credit tightens or buyers wait for better terms.
What does the latest Saudi Arabia index imply for early 2026?
The official real estate price index fell 0.7% year on year in Q4 2025. That suggests softer pricing into year-end, so Q1 needs the next print to confirm direction.
How should I read Israel when city trends look different?
Use the national index for direction, then check city-level splits and unsold stock. Uneven moves can mean demand is shifting, not disappearing.
What is the safest way to judge redevelopment land deals across these markets?
Start with zoning and permits, then test services capacity and build costs. Finally, validate exit speed with closed deals and mortgage comfort, not only asking prices.